
To reduce survey dropout rates, you have to find the exact question where people leave, cut the friction around it, and make finishing feel easier than quitting. Most teams do this backwards: they shorten the whole questionnaire when 10% of their loss sits on a single badly worded item. The seven fixes below run in order, from diagnosis to measurement, and most teams get a usable improvement from the first two alone.
This guide covers questionnaire dropout only. Search results for “dropout rate” are crowded with course and school attrition pages, which is a different problem with different fixes. If you are fielding an online survey, CX pulse, employee engagement questionnaire, or UX intercept, you are in the right place.
Expect to spend a couple of hours on diagnosis before you change a single question. That hour usually pays for itself within one fielding wave.
Table of Contents
- What You Need
- How to Reduce Survey Dropout Rates Step by Step
- Map Where Respondents Leave
- Remove Low-Value Questions and Friction
- Improve Question Order and Survey Flow
- Test the Survey With Real Respondents
- Choose Better Timing and Send Useful Reminders
- Make Resuming and Completion Effortless
- Track the Change and Establish a Better Benchmark
- How to Reduce Survey Dropout Rates by Survey Type
- Common Mistakes
- Frequently Asked Questions
- How long should an online survey be to minimize dropout?
- What is an acceptable survey dropout rate?
- Do survey incentives reduce dropout without lowering data quality?
- Should I use a different survey design for mobile respondents?
- How many reminders should I send to improve survey completion?
- Can I reduce dropout after the survey has already launched?
- Conclusion
What You Need
Before touching the survey, gather five things. Without them you are guessing, and guessed fixes tend to make things worse.
- Your response data at the item level – starts, partials, completes, and completion per question, not just the final completion count.
- An honest estimated completion time – timed in a pilot, not guessed from question count.
- Your target respondent profile – who was invited, who actually started, and on what device.
- Access to your survey platform’s logic and settings – skip logic, progress display, resume links, respondent keys.
- A baseline dropout rate – the number you will compare every later change against.
Here is the definition most methodology texts use. Survey dropout rate is the share of interview starts that never reach a submitted response: dropout rate = incomplete interviews divided by total interview starts. It is not response rate, which measures how many invited people started at all.
You also need to set a threshold for what counts as incomplete. A break-off is a respondent who stopped at a specific point and did not return. A partial completion is someone whose answers exceeded a minimum threshold you defined in advance – commonly 50% of the core questions – but who never submitted. Pick that threshold before you look at the numbers, because choosing it afterwards lets you flatter the result.
One note on real-world tooling. A fieldwork provider has documented cases where an invite email triggered link security scanners that opened the survey and abandoned it instantly, pushing apparent dropout from above 99% down to under 10% once a landing page was placed in front of the link. If your numbers look absurd, check that before you rewrite the questionnaire.
How to Reduce Survey Dropout Rates Step by Step
Map Where Respondents Leave

Dropout is not spread evenly. Pull the per-question completion curve and look for the step where the surviving share falls hardest. That step is your problem, and it usually has a specific cause.
Three signals separate the causes apart:
- Early abandonment – most loss before question three. Almost always the landing page, the stated time, or an unclear first question.
- A single spike mid-survey – one item, one grid, one upload, one sensitive question.
- Late fatigue – a steady decline across the back half. Length, not content, is the issue.
Split the curve by device as well. Long questions and open text hurt far more on phones than on laptops, so a survey that looks acceptable on a desktop report can still be falling apart on mobile.
How you verify it: state the highest-abandonment question and its base percentage in a plain sentence before you decide what to change. If you cannot name it in one sentence, your data is not granular enough for the diagnosis yet.
Remove Low-Value Questions and Friction
Now audit the questionnaire line by line. For every item ask: does a decision in this project change if I get a different answer? If not, delete it.
The usual offenders are duplicated constructs, “other” options that duplicate a listed choice, reference periods nobody can recall, and demographics already captured at recruitment. Matrix grids also cost more than they appear to – respondents report losing their place on a grid of twenty rows on a phone screen.
Do not strip the survey down mechanically. Removing an item your analysis depends on does not raise completion, it lowers your ability to act on the answers. Cut items that inform no decision, not items that inform a decision you find inconvenient.
How you verify it: compare the mean completion time of the shortened version against the baseline. If median time barely moved while completion rose, the friction you removed was friction. If time fell by half and completion did not move, you probably cut content you needed.
Improve Question Order and Survey Flow
Order changes completion more often than people expect, because fatigue is cumulative and attention is not.
A sequence that tends to hold up: screening and broad context first, then the detailed rating blocks that carry the analysis, then anything sensitive or difficult, with optional open text at the end. Screening first stops ineligible people early instead of halfway through. Open text last means nobody abandons at a text box they did not want to type in.
Add a one-line transition between sections – “Four questions about pricing, then we’re done.” Respondents handle far better when they know what is coming and roughly how much is left.
Attention checks are fine, used sparingly and explained. One buried in question fourteen reads as a trap; one placed early and described plainly reads as quality control.
How you verify it: run the reordered version against a split sample or the next fielding wave and compare the per-question curve shape, not just the final number.
Test the Survey With Real Respondents
Researchers catch what nobody catches from the questionnaire itself. Run three to five cognitive interviews where people talk through their thinking out loud, then pilot with ten to twenty people who are close to your real audience.
Watch for the small hesitations. A repeated “what does this mean?” or a long pause on one option is a wording problem. An interviewer note that nobody mentions the same item twice is your signal to leave it alone.
Measure median completion time in the pilot and write it into the invite. Also count how many pilot respondents asked what the survey was for – that number usually exceeds what you expect and points at the intro screen.
How you verify it: apply a pass-or-revise rule in advance. Pass if median time is within your target, no item confuses more than one in five pilot participants, and every item passes the decision-usefulness test. Anything else gets revised and re-piloted once.
Choose Better Timing and Send Useful Reminders
When you send changes who finishes. Launch inside working hours on a weekday, when people can complete a survey without it turning into an evening project. Avoid the Monday-morning inbox, the Friday-afternoon slump, and any send that lands outside the respondent’s local working day.
Cap reminders at two or three, spread over a window that suits the survey’s length. A five-minute survey does not need a three-week fielding period.
Vary the wording each time. The first reminder can be a short nudge, the second can restate the deadline and what is left, and the last can be the last one – literally. Repeated identical messages read as spam and train people to ignore your sender address.
Each contact should land directly on the respondent’s saved progress, not on a fresh link. Do not chase people who already completed; a completed-thank-you arriving two minutes after completion feels careless.
How you verify it: watch completion rate by contact wave. If the third reminder produces almost nothing and generates unsubscribes, stop at two.
Make Resuming and Completion Effortless
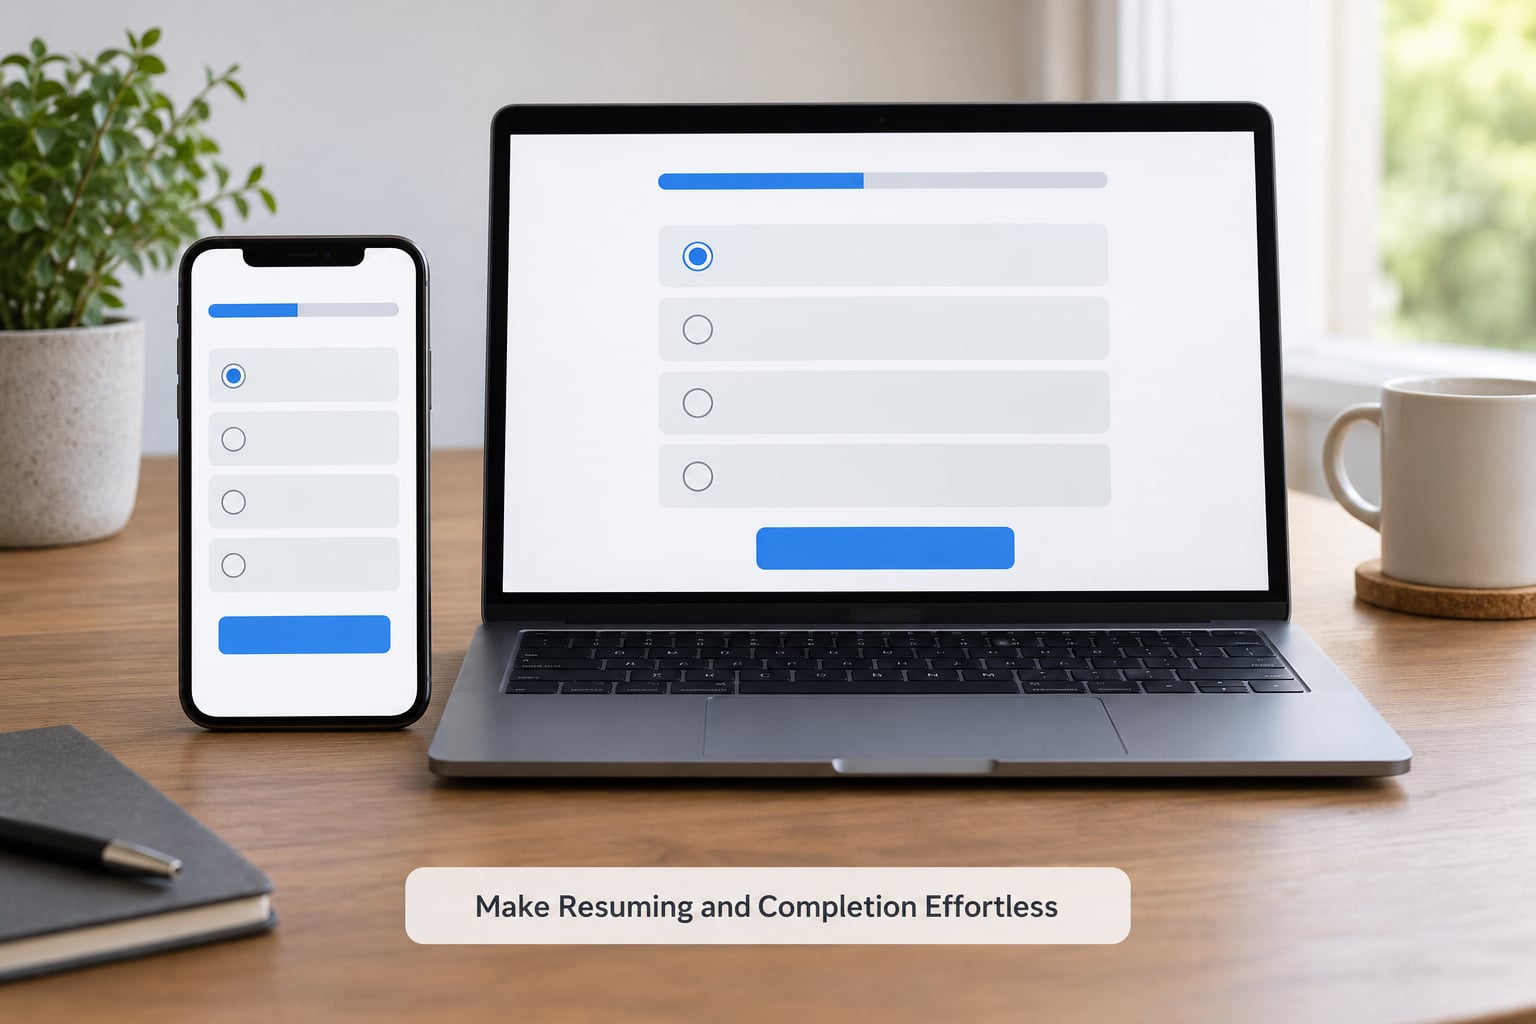
Most abandonment is a friction decision made in under a second. Give people the mechanical reasons to continue.
- Save and resume – persist progress so a respondent who closed the tab can return to the same question, not question one.
- One question per screen on mobile – with large tap targets and a clear next control. Page-per-screen is often right for phones and unnecessary on desktop.
- Persistent navigation – a visible back control that does not discard answers.
- Progress visibility – a progress bar or “7 of 18” counter, updated honestly.
- Accessible controls – keyboard navigable, screen-reader labels, colour contrast that survives outdoor light.
Test all of it on a real phone, not a desktop browser resized. Autosave that silently loses the last three answers is worse than no autosave, because the respondent believes their work is safe.
How you verify it: run a short task test with five people on a phone and watch how many taps it takes to move through three questions. Then check your device-split completion numbers after the change.
Track the Change and Establish a Better Benchmark
Dropout moves for reasons that have nothing to do with your questionnaire – a bad recruit link, a holiday, a competitor’s campaign, a change in device mix. So compare like with like.
Track these weekly while the survey is live: interview starts, partials, completes, completion rate, median completion time, drop-off by question, and the mobile versus desktop split. Write them down before you start changing things so you have a real baseline.
When you compare before and after, hold constant the recruitment source, the audience definition, the fieldwork dates, the incentive, and the device mix where you can. If two of those changed at once, you have learned nothing.
How to reduce survey dropout rates over time, then, is mostly a measurement discipline: change one lever, hold the rest steady, and give it one wave before drawing a conclusion. Set a checkpoint two weeks after the change and compare against the old baseline rather than against a target you invented in January.
How to Reduce Survey Dropout Rates by Survey Type
The ranges below are practical yardsticks drawn from field practice, not hard rules. The number that matters most is your own trend.
- Customer satisfaction and NPS pulse – typically under 2 minutes. Investigate break-off above 15%. Long branches, routing that skips visibly, and mobile grids drive most of it.
- Employee engagement – usually 8 to 12 minutes, with 25% break-off as the line to watch. Length, fear of identifiability, and reminders that feel like pressure are the usual causes.
- Academic questionnaire – often 10 to 15 minutes with break-off above 30%. Open text, sensitive items placed too early, and unclear consent do the damage.
- Market research panel study – 15 to 25 minutes, also with break-off above 30%. Quotas filled unevenly, matrix blocks, and incentive ambiguity cost you respondents.
- UX or intercept survey – 2 to 5 minutes, with break-off above 20% worth a look. Intrusive triggers, unskippable questions, and session timing drive this one.
- Mobile-only field – under 5 minutes is realistic, break-off above 20%. Any open text, any grid, any multi-step form will cost you.
Break-off rates above these bands are worth investigating; rates below them usually mean you are losing starts entirely rather than respondents mid-survey, which is a recruitment problem rather than a design problem.
Common Mistakes
Cutting the survey in half to fix a 3% problem. Deleting a section that carries real analysis weight does not raise completion, it makes your results unusable. Fix the item that is actually losing people.
Changing five things at once. A new intro, new logic, a new incentive and a new send schedule in the same wave produce a number you cannot interpret. Change one lever per wave.
Rewarding speed instead of quality. A guaranteed reward attached to a very short survey invites straightlining and garbage open text. Tie incentives to completion, not to speed, and keep the reward credible – promising a prize draw you never run is the fastest way to lose the respondents you have left.
Sending reminders until people stop opening them. Three contacts is usually the ceiling. Past that you are trading completion for unsubscribes and sender reputation.
Treating every abandonment point the same. Early abandonment, a mid-survey spike and late fatigue are three different problems with three different fixes. Averaging them into one number hides the one you can actually solve.
Reading dropout as if it were neutral noise. It is not. People who quit tend to differ from people who finish, so a high dropout rate quietly shifts who your results describe. Weighting on observable characteristics is the traditional correction, but trimming the causes of break-off is the cheaper one.
Three habits I would keep: check the per-question curve before opening the editor, write down every change you make to a live survey, and treat your own median completion time as a promise you have to keep in the invite copy. Updated for 2026, most surveys can hold a 5 to 10 minute completion without losing people – the ones that cannot are usually failing on flow, not on length.
Frequently Asked Questions
How long should an online survey be to minimize dropout?
For customer and intercept surveys, under five minutes keeps completion strong. Employee engagement and academic questionnaires can run eight to fifteen minutes when the topic genuinely warrants it, but state the estimate honestly up front and cut anything that informs no decision. Length matters less than flow: a badly ordered twelve-minute survey loses more people than a well-ordered fifteen-minute one.
What is an acceptable survey dropout rate?
It depends on the survey type. NPS and short intercept surveys usually hold above 85% completion, so break-off above 15% deserves attention. Employee, academic and panel studies running ten to twenty-five minutes commonly see 20 to 35% break-off, and that is normal if it is stable and spread across items rather than spiked on one question.
Do survey incentives reduce dropout without lowering data quality?
Incentives reliably lift completion, but a small guaranteed reward attached to a short survey can attract straightliners and careless open text. Choose a guaranteed modest reward over a large prize draw where the audience is broad, attach payment to completion rather than speed, disclose the odds for any draw, and follow through. An undelivered incentive damages response rates permanently.
Should I use a different survey design for mobile respondents?
Yes. On phones, show one question per screen, keep tap targets large, drop matrix grids in favour of stacked scales, and make open text optional rather than required. Many platforms serve one layout to every device by default; a mobile-specific version of the same questions routinely outperforms the shared layout on completion and on data quality.
How many reminders should I send to improve survey completion?
Two or three reminders is the practical ceiling. Space them across a fielding window matched to survey length, vary the wording each time, make the last one clearly the last, and send each contact to saved progress rather than a fresh start. If the third reminder produces almost no completions and generates unsubscribes, stop at two.
Can I reduce dropout after the survey has already launched?
Yes, and you can start with the fieldwork you have not touched yet. Fix the highest-abandonment question, add or correct the progress indicator, switch on save and resume, shorten the intro, and send one targeted reminder to partial respondents only. Splitting the live link by respondent lets you change the design for new starts while preserving the earlier sample for comparison.
Conclusion
Reducing survey dropout rates is mostly diagnosis done properly. Find the question where the curve falls, decide whether the loss is early, spiked or late, and match the fix to that shape – friction removal for a spike, restructuring for late fatigue, and a shorter intro for early abandonment.
Start with one action today: pull your per-question drop-off curve, name the highest-abandonment item, read its wording and placement out loud, and test a revised version on ten people before you send the full survey again. Update the baseline the same week, then change one lever per wave so you can still tell what worked.