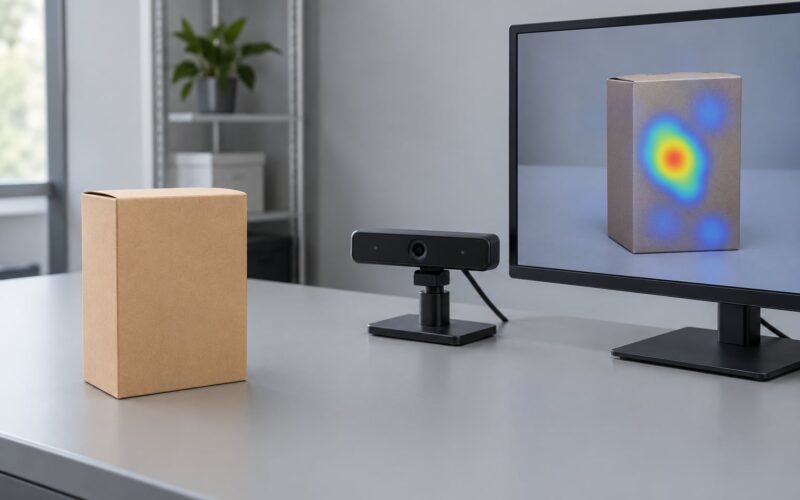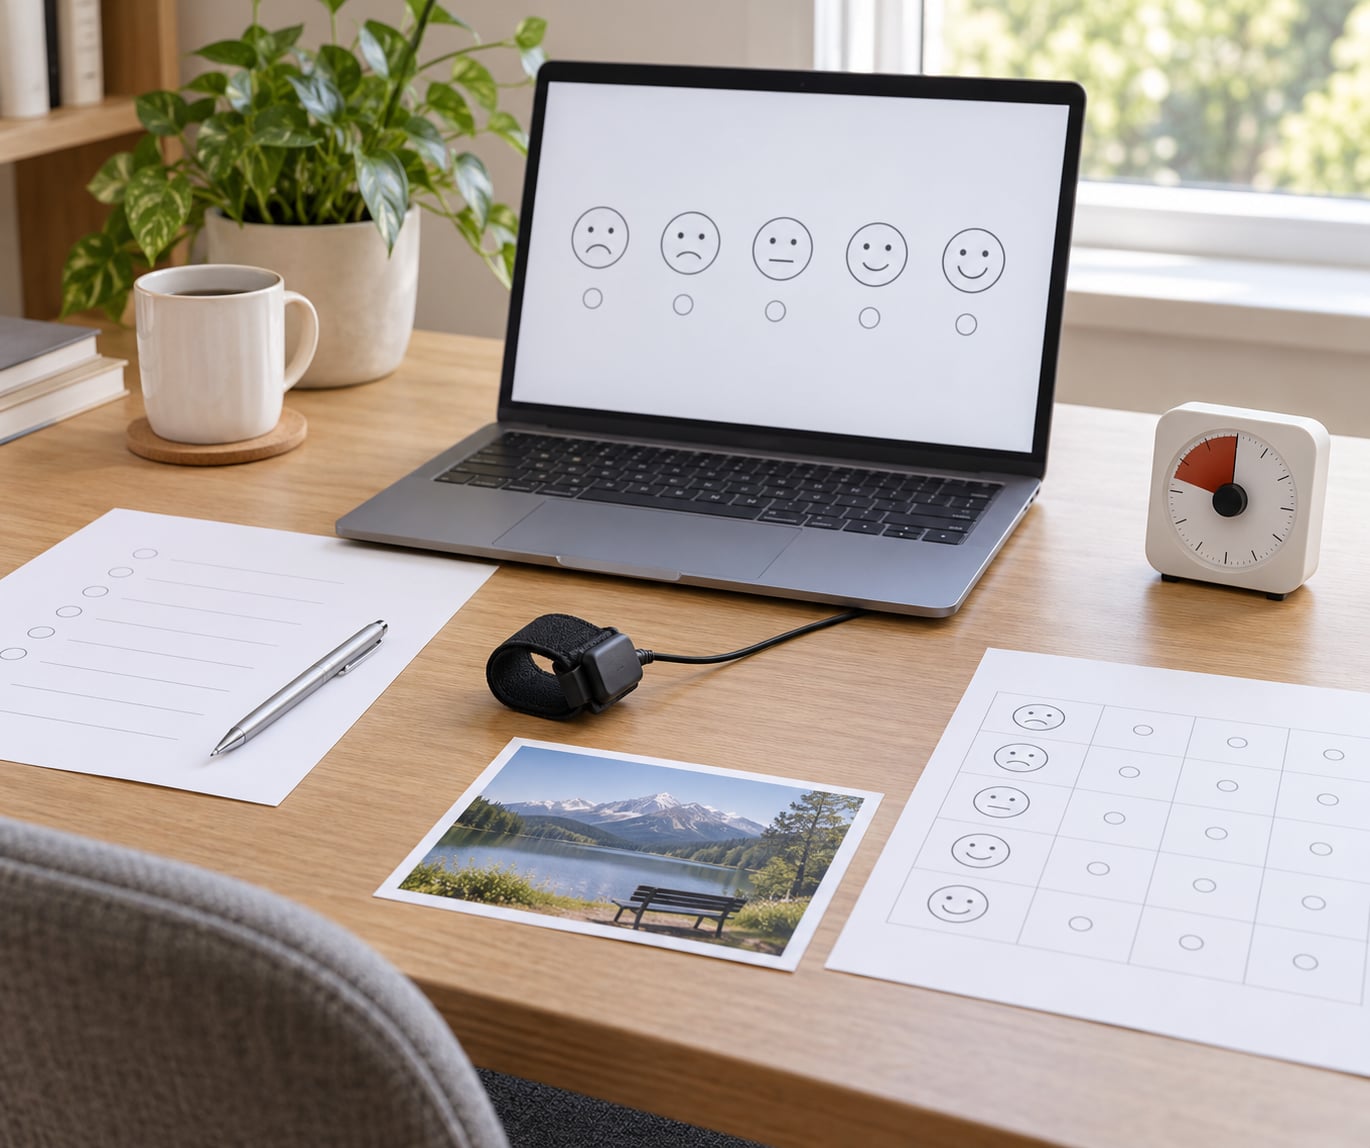
Emotional intensity in ad response is how strongly a viewer reacts to a commercial, and in which direction, captured as three things together: valence (positive or negative), arousal (how activated they are), and the timing and size of emotional peaks across the runtime. You measure it by recording a continuous signal while the ad plays, then grading the peaks. A focused study takes two to six weeks depending on method.
Most teams measure liking instead of intensity, which is why a spot can win the room and still underperform. Liking is a preference judgment. Intensity is magnitude, and the two come apart more often than advertisers expect.
The method you pick matters less than matching it to the decision you need to make. If you are choosing between two edits, second-by-second measurement is the point. If you are arguing about whether a campaign built emotional equity, a continuous rating scale and a behavioral task will tell you more than any sensor will.
Table of Contents
- What You Need
- Step-by-Step
- 1. Define the emotional response you want to measure
- 2. Choose measures that match the research question
- 3. Set the exposure and question order
- 4. Quantify intensity rather than labeling every reaction
- 5. Compare audiences, ads, and moments
- 6. Report the result and turn it into a decision
- Common Mistakes
- Frequently Asked Questions
- How do you quantify emotions?
- What emotion holds the highest frequency in advertising research?
- Which emotion measurement method is most reliable for ads?
- Is facial coding accurate for measuring ad response?
- How many participants do you need for an ad emotion study?
- What are the signs and symptoms of emotional dysregulation in adults?
- Conclusion
What You Need
Before you buy any hardware, decide what the study has to settle. A research instrument that produces a beautiful activation curve and no decision is a way to feel rigorous while learning nothing.
A locked ad cut. Measure the exact edit that will run, at final length, with the final supers and end card. A 30-second cut trimmed to 15 seconds for testing is a different ad, and the intensity curve will differ. One EEG study cited in practitioner discussions found a 15-second cut matched or beat its full 30-second version on memory and attention, which is exactly the kind of finding a rough test would have missed.
A defined audience and exposure setting. Where the ad plays changes the response. Mediaprobe’s analysis of more than 250 million data points found live sports on streaming produced 9% higher emotional impact than the same content on linear TV, with 3.86 times more Level 1 emotional peaks, 2.70 times more Level 2 peaks, 2.23 times more Level 3 and 1.82 times more Level 4. If your testing room has no ambient noise, no second screen and no phone, you are not measuring the environment your ad runs in.
Emotion measurement questions that separate type from magnitude. Ask what the viewer felt, how strongly, and when. A single “did you like this ad” question collapses everything you need to distinguish into one number.
A scale or behavioral task suited to the question. Continuous pictorial scales, dimensional ratings, an implicit association task, or a memory probe. Choose one deliberately rather than inheriting whatever the panel form already includes.
A decision rule set in advance. Write down what score difference would make you cut variant B, before you see the data. Without it, an arch gets read backwards after the fact by whoever is most attached to the edit.
Sensors, only if you need temporal detail. Skin conductance sensors, a heart rate monitor, an eye tracker, and sometimes EEG. These cost real money and add setup time, so they are worth commissioning when the question is about timing, not just direction.
Step-by-Step
Here is the order that works. Each step assumes the one before it, and skipping ahead is what produces the usual mess of confident conclusions from thin data.
1. Define the emotional response you want to measure
Intensity is magnitude, not category membership, and most confused reporting comes from treating the two as the same thing. A viewer can feel joy weakly, and dread strongly, and a tool that only labels the category will score both as “yes, emotional” and call it a day.
Separate four things before you write a single question. Emotion type is the label: pride, amusement, tension, nostalgia. Intensity is how much of it. Duration is how long it lasts, and a two-second spike in a 30-second spot is a different animal from a sustained lift across the whole arc. Behavioral impact is what it does next: recall, favorability, purchase intent, search, click.
Deciding which of the four you are measuring prevents the most common failure in this space, where a study claims to have found strong emotion and then reports a favorability score instead. It also changes what you instrument. Type and intensity can come from a rating question. Duration and peak location need a continuous signal.
If you are working inside the psychology literature rather than a media plan, the Affective Intensity Measure (Larsen, 1984) is the instrument most people mean when they say “how do you measure how strongly someone feels”. It is designed for individual differences in typical emotional responding, which is a different question from how intense a response was to one specific ad, and it is worth being clear about which of the two you are asking.
2. Choose measures that match the research question
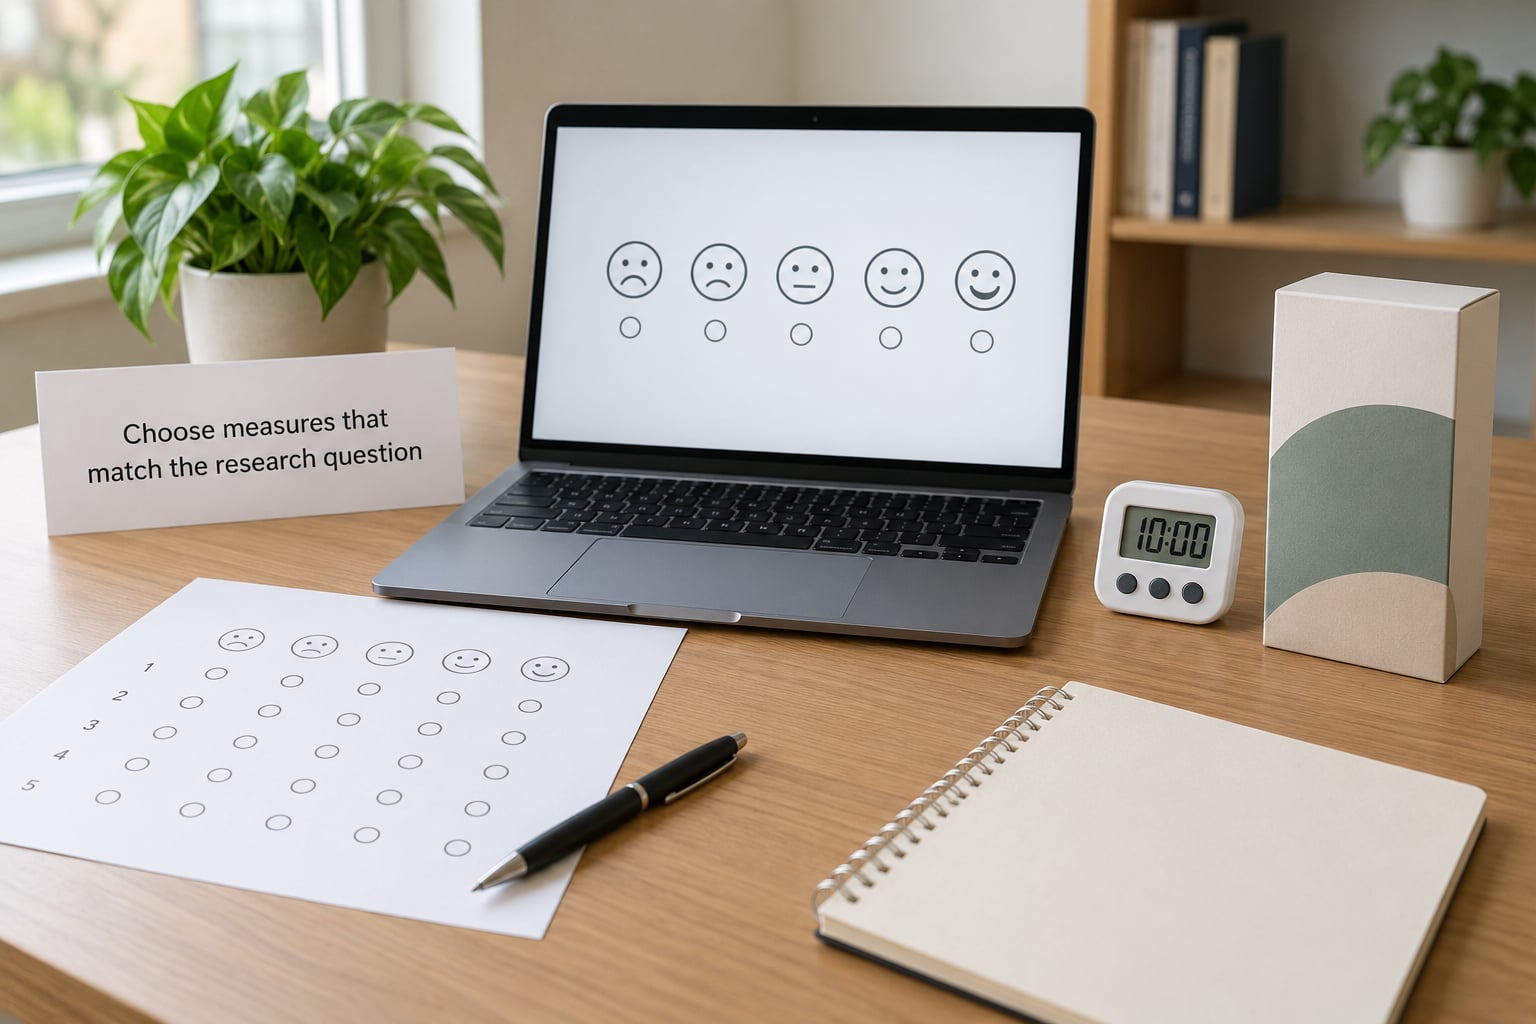
There are four families, and no single one covers the whole construct. Here is what each captures, what it costs you, and where it breaks.
Self-report scales. Continuous pictorial instruments like the Self-Assessment Manikin (SAM) and the more recent EmojiGrid both rate on valence and arousal separately rather than forcing one happy-or-sad button. The Affective Intensity Measure covers typical intensity. These are cheap, fast and easy to administer, and they are the only family that can tell you whether activation felt good or bad. The weakness is that a scale answered after the ad describes memory and reconstruction of a response, not the response itself, and forcing a blended state into one point on a line loses the blend.
That last problem is what fuzzy logic approaches in marketing. Instead of scoring a viewer as 70% satisfied or 20% satisfied, a membership model lets the same person be 70% satisfied, 20% neutral and 10% confused at once, then defuzzifies those degrees of membership into a single interpretable score. The objection practitioners raise immediately is that this is just Likert with extra steps, and it is a fair question to ask of any model presented without a worked example. The useful version shows you the membership split, not just the defuzzified output.
Implicit and behavioral measures. The Implicit Association Test gives you a response-time-derived bias score rather than a stated preference, which sidesteps demand characteristics and the social pressure to say a commissioned ad was good. Word-fragment completion, memory probes and delayed recall tasks fit here too. These are the strongest tools for the question “did this ad do anything to memory”, and the weakest for “how did it feel while it played”.
Physiological measures. Electrodermal activity, usually sold as galvanic skin response or skin conductance, is the workhorse: sweat glands respond to sympathetic activation, and you get a second-by-second trace for free. Heart rate adds cardiac cost and is harder to interpret; heart rate variability is more informative about recovery and sustained effort than about emotion. Eye tracking gives you attention and gaze path, which is not an emotional measure at all but tells you whether the peak moment was even seen. EEG reaches memory encoding directly, at the highest cost and the most interpretation work.
What physiological data cannot do is name the emotion. A spike tells you activation, not whether it was excitement or anxiety, and Mediaprobe states this bluntly: having data without understanding what it means is waste. Always pair a physiological trace with something that carries direction.
Facial coding. Systems built on the Facial Action Coding System detect action units from video and map them to emotion labels. The honest limit is that viewers watching a commercial alone at home frequently produce very little expressive movement at all, and Mediaprobe dropped facial coding for ad work for exactly that reason. There is a further sampling problem: expression datasets carry racial and cultural expression bias, facial cues overlap heavily across categories, and newer taxonomies such as EMONET-FACE (Schuhmann and colleagues, 2025) have expanded from the classic six to eight basic emotions to 40 categories because the original set was too coarse. Performance still degrades on ambiguous frames and on frontier vision-language models.
Treat facial coding as a supporting signal rather than a verdict. In a group setting with a camera and a discussion, it works better. Alone in a lounge with a phone, it will often report nothing, and nothing here does not mean neutral.
How the four combine. A workable design pairs a continuous physiological trace with a directional self-report and one behavioral outcome. That triangulation is what lets you distinguish a high-arousal response that was pleasant from one that was anxious, and it is convergent validity doing its job. If your methods disagree, the disagreement is information, not noise, and step 5 covers what to do with it.
3. Set the exposure and question order
Standardize exposure or your numbers are decoration. Same screen size, same viewing distance, same room conditions, same time of day for every participant, no phone, no second screen, and a written protocol for what the moderator does when the ad ends.
Decide in advance whether participants see the ad once, as in market, or three times in a wear-out study. Those are different experiments and their answers will not agree, so do not mix them in one session.
Collect the reaction before memory starts rewriting it. A rating taken ten minutes later measures recall of the ad and a mood the viewer is currently in, which is a much weaker proxy for intensity than one taken within seconds. This is also the strongest argument against post-ad surveys generally: asking the viewer interrupts the emotional process and destroys the second-by-second granularity you were trying to capture in the first place. Every point of temporal resolution you need is gone by the time the question appears.
Randomize question order across conditions and keep the emotion questions ahead of evaluative ones. If you ask “how much did you like it” first, the rating that follows is a justification of that judgment rather than a fresh read of the response. Pilot the whole instrument once, because the first version of any form is always longer than people expect and the last three questions are where drop-off concentrates.
4. Quantify intensity rather than labeling every reaction
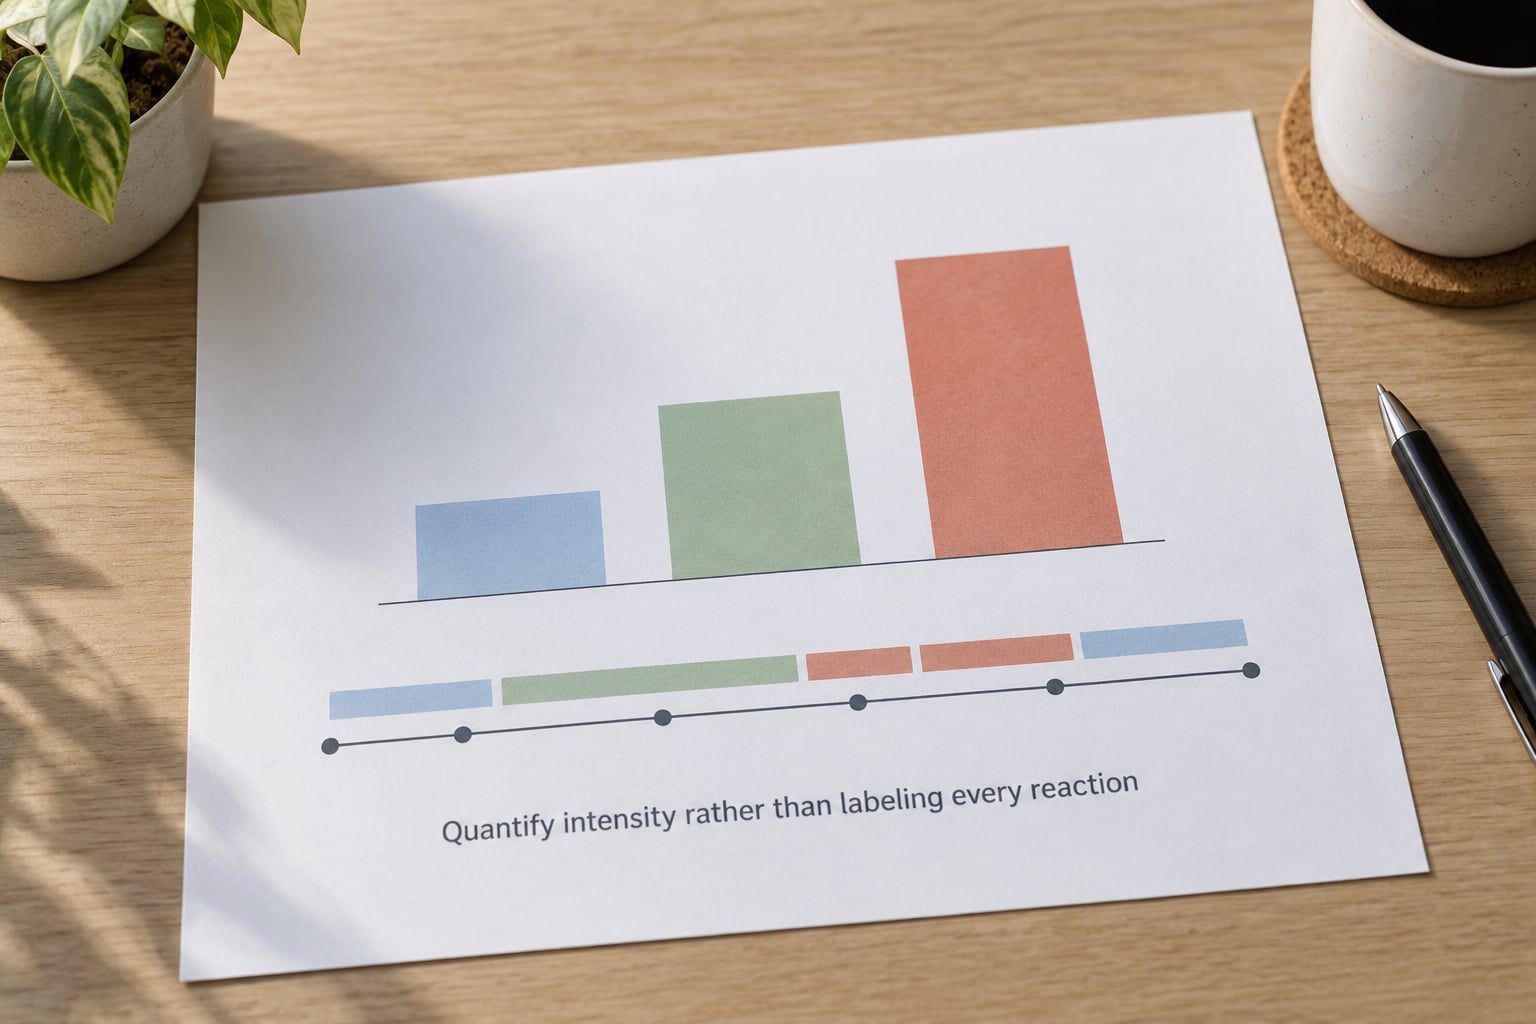
Raw traces and single ratings both need conversion before anyone can act on them. Here is the sequence that works, and it is the piece no competitor currently explains in print.
Detect peaks. From the skin conductance trace, find local maxima above a per-person baseline and above a minimum amplitude threshold you set before looking at the results. Each peak gets a timecode. You now have a list of moments rather than a cloud.
Grade each peak. A four-level vocabulary is already in industry use and it is worth adopting so your numbers can be compared with other people’s. Level 1 is extreme activation, the top of the scale; Level 4 is the mildest band that is still distinguishable from baseline. Mediaprobe’s streaming-versus-linear comparison works precisely because it counts peaks by level, which is why the ratio figures above exist. Grading is a judgement call, so have two people code independently and report agreement rather than quietly reconciling disagreements.
Measure activation rise time. How long from ad start to first meaningful peak, in seconds. This is the most actionable number in the whole workflow, because it predicts skip behavior in environments where skipping is possible. An ad that peaks at 1.5 seconds survives a skippable environment; one that peaks at 12 seconds has already lost the people who were leaving.
Map the emotional arch. Plot the graded peaks against time and read the shape. A steady ramp with one late peak, a flat line with a single spike at the logo, and a jagged sawtooth all imply different creative problems, and the shape tells you more than any average does. In Mediaprobe’s Unilever Portugal live study (n=55), the team used exactly this view: rise time, segment-level peak verification, investigation of unexpected peaks, benchmark comparison and then correlation back to the survey data. That five-step reading is the most practically useful published workflow on ad emotional measurement.
Convert to a band, not a decimal. For skin conductance specifically, resist publishing a per-second number with four decimal places. Compute a per-person peak count and a mean peak amplitude, express each as a z-score against that person’s own baseline, then band the result as low, moderate or strong. The bands come from your own norms for that format and length, so establish them on a control set before you compare two spots.
Keep the respondent’s own pattern in frame. One practitioner workaround for noisy data is to score each item against the respondent’s own mean using within-respondent standard deviation rather than fixed scale anchors. It is a small correction that removes a lot of the noise practitioners complain about when a survey returns a distribution everyone finds implausible.
One caution from that Unilever study is worth carrying: during high-arousal moments the team picked up unforeseen memory associations, content viewers had no reason to connect to the ad. High intensity is a good tool for building memory and a careless one for controlling what gets remembered.
5. Compare audiences, ads, and moments
Segment before you celebrate. Average intensity across a mixed sample hides more than it shows, and segment-level peak verification is one of the five checks in Mediaprobe’s own analysis workflow. Older viewers in one cited study recalled emotional ads at 22% against 7% for rational ones, while younger viewers went the other way at 40% against 13% for rational appeals. Those are different campaigns, not a better and a worse one.
Compare creative variants on the same signal, not across methods. A 30-second spot and a 6-second cut have different arch shapes, and comparing raw peak counts between them is meaningless. Compare like with like, or normalize per second of exposure.
Check placement. The streaming-versus-linear gap above is large enough that pooling those exposures would bury it.
Watch decay. Ad fatigue and wear-out are the biggest blind spot in published ad emotion research, and they are the first thing that changes when a spot has been in market for six months. Re-test the same creative on a schedule, not once. A creative that peaked strongly at launch and flatlines by week ten has told you something a launch test never could.
When your methods disagree, work through it in a fixed order. Facial coding says nothing and skin conductance says high activation, so the likeliest reading is that the viewer was genuinely activated without producing visible expression, which is common in solo viewing; trust the physiological trace for timing and downgrade the facial result. Self-report says mild while every other signal says high, check for an acquiescence or demand effect and for straight-liners who rated everything. Physiological says flat and self-report says strong, suspect a failed sensor baseline before you doubt the ad. A 50% favorable and 50% unfavorable split produces the same headline number as 50% favorable and 50% neutral, and those two require opposite interventions, which is the clearest argument for reporting the distribution rather than the mean.
Report the sample size every time. The n=55 Unilever study is cited more often than most far larger ones precisely because the number was stated up front, and readers treat a study with no n as marketing.
6. Report the result and turn it into a decision
An intensity score on its own is not a result. Report it beside the emotion type, the peak grades with timecodes, the activation rise time, the sample size, the method and its limits, and the behavioral consequence: recall, favorability, intent or action.
Then apply the rule that decides whether a high score is good news. Arousal only helps when it matches what the ad is claiming. Work from a 2021 University of Illinois study found that high emotional arousal hurts immediate memory while helping memory measured later, and only when the arousal level matched the ad’s claim. An ad claiming calm reliability that spikes the viewer’s heart rate will lose immediate recall and buy a delayed effect it was not designed for.
So the honest reading of a strong score is conditional. A sustained positive arch in a brand-building ad, with favorable lift and no skip spike, is a good result. A sharp Level 1 spike at 2 seconds in an ad that promises security is a problem wearing a good number. The measurement does not decide the creative; it tells you what the creative did, and you compare that to what it was supposed to do.
Before you commission a neuroscience test, settle the ethics and consent question properly. You are handling data about responses people did not choose to report, and that deserves a clear purpose, informed consent covering physiological recording, a data retention policy and an ethics review where your institution or jurisdiction requires one. Practitioners who run subconscious-response measurement treat this as standard, and researchers who skip it are the ones who struggle when the method comes under scrutiny.
Common Mistakes
Measuring liking and calling it intensity. A favorability score tells you the ad was acceptable. Intensity is a magnitude reading on a continuous scale, and the two can point in opposite directions: a familiar brand ad that viewers rate highly for warmth can sit at a flat, low-amplitude arch, while a first-time spot that is mildly liked can produce a large, clean peak. Fix: add a continuous intensity rating or a peak-graded physiological trace, and report both.
Relying on facial coding alone. Solo viewing produces little facial movement, expression datasets carry racial and cultural expression bias, and overlapping cues make single-label classification unreliable even in newer systems with 40 categories rather than eight. Fix: use facial coding as a supporting signal in group settings, and pair it with a directional measure.
Asking vague questions. “How did the ad make you feel?” produces a sentence you cannot score. Fix: separate type, intensity and timing into three items, and put timing in continuous form rather than as a multiple-choice list of named segments.
Comparing incompatible scales. A 7-point scale in one study and a 9-point scale in another, or a pictorial scale against a verbal one, are not the same instrument. Fix: fix one instrument across all cells of the study and re-run the earlier condition if you must change it.
Treating physiological arousal as a specific emotion. Skin conductance rises during excitement, fear, concentration and discomfort alike. Fix: report activation and direction as two separate findings, from two separate sources, and never let a vendor’s chart imply that a sweat spike identified a feeling.
Reporting averages without context. A mean intensity of 3.4 on a five-point scale tells you nothing about shape, timing, segment or consequence. Fix: report the arch, the peak grades, the rise time, the distribution and the n alongside any headline figure.
Two smaller habits worth keeping. Score against the respondent’s own baseline where the data is noisy, and state the date of everything you cite, because this field’s published record runs from 1996 forward and readers discount undated claims accordingly.
Frequently Asked Questions
How do you quantify emotions?
Quantify emotion as two independent dimensions plus a shape. Valence is whether the response is positive or negative, arousal is how activated the viewer is, and the shape is where the peaks fall and how large they are. A 30-second ad that lifts arousal smoothly and a second ad that spikes hard at 2 seconds both read as intense, but they call for different creative decisions, so report all three rather than one score.
What emotion holds the highest frequency in advertising research?
No emotion is proven most frequent across advertisers, because the answer depends on category, culture and how you label. What is clear is that single-label tools misread ad response, which is why newer taxonomies such as EMONET-FACE expanded from the classic six to eight basic emotions to 40 categories in 2025. Practically, report valence and arousal as continuous dimensions and let the category name sit alongside rather than replace them.
Which emotion measurement method is most reliable for ads?
None is most reliable on its own, because the methods measure different things. Continuous self-report gives direction cheaply, skin conductance gives second-by-second activation, and behavioral or memory tasks show whether anything stuck. The defensible answer is a pair: a directional rating with a continuous trace, plus one behavioral outcome, which is what convergent validity is for. Vendors who rank their own method first are selling, not comparing.
Is facial coding accurate for measuring ad response?
It is accurate in some settings and close to useless in others. Facial coding works reasonably when viewers are together and talking, and performs poorly in solo viewing, where people often show very little expression, so an empty result does not mean a neutral response. Expression datasets also carry racial and cultural expression bias. Use it as a supporting signal alongside a directional measure, never as the sole verdict.
How many participants do you need for an ad emotion study?
A physiological study with 55 participants has been published and treated as credible, which sets a practical floor for exploratory creative testing rather than segment-level conclusions. For self-report scales you can go lower for a directional read and higher for segment cuts. As a working rule, treat 50 to 60 as enough to spot an arch and its rise time, and double it or triple it when you need reliable differences between audience segments or between two close variants.
What are the signs and symptoms of emotional dysregulation in adults?
That question is clinical, and it is worth separating from this one. Emotional dysregulation in adults is typically described as difficulty managing or responding to emotions in ways that interfere with daily life, and it is assessed by clinicians, not by an ad pre-test. A strong measured response to a commercial is an ordinary reaction to a stimulus and carries no clinical meaning. If the underlying question is clinical, speak to a qualified health professional.
Conclusion
Start with the definition, not the equipment. Decide whether you are measuring emotion type, intensity, duration or behavioral impact, because only some of those need a sensor.
Then pair one continuous intensity measure with one directional measure and one behavioral outcome, convert the trace into graded peaks and a rise time, and read the result against what the ad was actually claiming. A high score that contradicts the claim is a finding, not a success. The methodology is settled enough to 2026, and the only real remaining question is which decision you are buying the answer for.