
To design an A/B test that answers a real question, start from the decision someone has to make, not from the button someone wants to repaint. A valid test names that decision, defines one answerable question with a single primary outcome, isolates the change in a treatment and control condition, and sets the stopping condition before launch. Everything else is bookkeeping.
The order matters more than most people expect. Most tests that teach nothing are not badly analyzed. They were designed backwards, from an idea to a metric instead of from a question to a decision, so the result could never have changed what anyone shipped.
That framing matters more for anyone who has to defend a test to stakeholders. Product managers, growth practitioners and data scientists all end up explaining why a test was or was not worth running, and the answer is much easier when the design document starts with the sentence “we need to decide X by the end of the quarter.” If you cannot write that sentence, you do not have a test yet.
Table of Contents
- What You Need
- Step-by-Step: How to Design an A/B Test That Answers a Real Question
- Start with the decision, not the variation
- Write one answerable research question
- Define the treatment and control conditions
- Choose one primary outcome and useful guardrails
- Set the minimum detectable effect and sample size
- Control the experiment
- Validate the test before reading the outcome
- Analyze the result and estimate the uncertainty
- Make and document the decision
- Common A/B Testing Mistakes
- Frequently Asked Questions
- How long should an A/B test run before checking results?
- What sample size do I need for a reliable A/B test?
- Can I test more than two variations in one experiment?
- When should I segment A/B test results by audience?
- Why is my A/B test showing no significant result?
- What should I do if my treatment wins but guardrail metrics fall?
- Conclusion
What You Need
Before you touch a tool, seven things need to be on paper. If any one of them is missing, the test will produce a number that nobody can act on.
- A specific decision the test will inform, with a named owner and a date. “Should we ship this onboarding change?” is a decision. “Can we make onboarding better?” is not.
- A clearly defined current alternative. The control is what users see today, including the version, the traffic it applies to, and any seasonal or campaign context around it.
- Candidate treatment ideas, each small enough that you could explain why it should work. Three changes in one variant produce a result you cannot interpret.
- An eligible audience, defined by the rules that decide who gets randomized. Geography, account type, device, cookie state and returning-versus-new all matter.
- Available traffic, roughly per day, for that audience. This number decides whether the test is confirmatory or only directional.
- Relevant outcome measures: one primary metric tied to the decision, plus diagnostics that explain movement and guardrails that catch harm.
- A randomization method: an experimentation platform, a feature flag service, or a server-side assignment you trust to split traffic evenly and stick to it.
If you cannot get honest traffic numbers, get them before designing anything. Sample size is a function of how many eligible users pass through, and estimating it after launch is how teams end up running a test for six weeks and calling a null result a lesson.
Step-by-Step: How to Design an A/B Test That Answers a Real Question
Start with the decision, not the variation
Write down the decision as a sentence with an owner, a deadline and a constraint. “By the end of the quarter, the growth lead will decide whether the annual-plan CTA ships to all new visitors, unless it reduces trial starts by more than 5 percent.”
Then name the evidence that would justify acting. This matters as much as the decision itself, because it forces you to think about what a convincing result looks like before you are attached to a variant. Three inputs usually cover it: the size of the effect worth acting on, the cost of running the test, and the cost of being wrong.
How do you tell this step worked? A reader who has never seen the product should be able to say what happens if the treatment wins, what happens if it loses, and who makes the call. If the sentence needs the word “maybe,” it is not finished.
The same discipline applies outside experimentation. Interview design follows the identical structure: clarify the objective, the unit of analysis, the exposure definition and the primary metric before proposing anything. Good research design is a habit of refusing to start at the solution.
Write one answerable research question
A question is answerable when four parts are present: the population, the intervention, the comparison and the outcome. “Does a shorter signup form increase completed registrations for self-serve trials among new visitors on mobile?” has all four. “Does the new page work better?” has none.
Here is the same vague request rewritten, because the rewrite is the practical skill most teams are missing:
| Unanswerable ask | Testable rewrite |
|---|---|
| Try a red button | Does changing the primary CTA color from grey to red increase trial starts for new visitors on desktop? |
| Improve the pricing page | Does moving the annual-plan CTA above the feature table increase annual-plan selections per pricing page view? |
| Our checkout drops off | Does removing the account-creation step from checkout for returning customers increase completed purchases without raising support contacts? |
| Personalize the homepage | Does showing returning customers their last viewed category on the homepage increase click-through to a product detail page? |
| Test a new onboarding | Does a three-step onboarding with progress saved server-side increase day-7 activation among new self-serve accounts? |
| Is the new nav better? | Does a task-oriented navigation with five top-level items increase search usage per session without increasing back-button exits? |
Check any proposed question against three tests: could the answer be “no”, is there a specific number that would change a decision, and would you be able to name the population next month without checking? A question that cannot come back “no” is a statement wearing a question mark.
Define the treatment and control conditions
The control is the current experience, live and serving traffic now. The treatment is one deliberate change. Write a screenshot or a short spec for each side and confirm that every other element is identical, because a diff that sneaks in a font change or a different tracking tag will quietly contaminate the comparison.
A hypothesis is the bridge between the two, and the useful form is conditional: if we change X for population P, then metric M will move by roughly D, because of mechanism Z. That last clause is what separates a hypothesis from a guess, and it is what tells you which diagnostic metric to watch. If your reason is “it looks better,” you have a preference, not a testable claim.
Bundle changes only when the bundle is the decision. If leadership genuinely wants to ship a redesigned flow as a unit, test it as a unit, but then report it as a package result and do not claim to know which part worked. That is a legitimate choice. It is just not the same as knowing.
Choose one primary outcome and useful guardrails
Pick the single metric that, if it moves in the right direction by a meaningful amount, would make you act. Metrics fall into three groups, and a test is only well designed when all three are named before launch.
| Metric type | Job | Example (signup form test) |
|---|---|---|
| Primary | Carries the decision. One per test. | Completed registrations per eligible visitor |
| Diagnostic | Explains why the primary moved or did not. | Field completion rate, time on form, error rate per field |
| Guardrail | Catches harm you would refuse to ship for. | Support contacts per signup, 30-day retention of registered users |
Why one primary metric? Because every metric you check for significance is a chance to be fooled. With twenty metrics, a couple of them will look significant purely by chance, and the one you report is likely to be the most flattering. Declaring one primary in advance removes that freedom.
Watch for the case where your average hides two opposite effects. A change can lift conversion for new visitors and cut it hard for returning ones, leaving a flat average that looks like a failed test. If a segment is important enough to stop the rollout, name it as a guardrail with its own threshold before you launch.
Set the minimum detectable effect and sample size
The minimum detectable effect, or MDE, is the smallest lift your test could reliably detect. Choose it from business value rather than from what would be nice to see. Is a one percent relative lift worth shipping and worth two weeks of traffic? If not, say so and stop pretending the test will answer it.
Then run the numbers. Take your baseline conversion rate, your MDE, a confidence level (95 percent is conventional) and a power target (80 percent is conventional), and put them into any sample size calculator. The output is the number of users you need per arm, not total.
Compare that number with your traffic. A rough duration estimate is:
test duration = (required sample size × 2) ÷ daily eligible traffic
If that lands beyond the decision deadline, you have four honest options: postpone the test to a period with more traffic, narrow the change so the expected effect is larger, accept a directional read and label it as one, or raise the MDE by agreeing on a bigger effect worth acting on. Practitioners on r/datasciencecareers treat that last lever as the fastest one when traffic is scarce, and they are usually right.
Underpowering is the quiet default. A test with too few users fails to reach significance even when a real effect is present, and the team then concludes the change did not work. That is the most expensive kind of wrong answer, because it does not look wrong at all.
Control the experiment
Randomization is the whole trick. Random assignment is what lets you attribute a difference to the change rather than to something else, and it is what separates a test from the kind of comparison that produces the familiar spurious correlation stories: ice cream sales and shark attacks both rise in summer, and nobody concludes that one causes the other.
Seven things to pin down before you turn the test on:
- Unit of randomization. Users, accounts, sessions or stores. If people share an account, randomizing by user lets information leak between arms.
- Unit of analysis. Where the metric is counted. These can differ, and when they do you need cluster-aware methods.
- Exposure point. The moment a user actually sees the change. This is the single most-skipped definition and it controls how long the test takes.
- Eligibility rules. Enumerated, logged, and applied at assignment time rather than at analysis time.
- Cross-exposure prevention. How a user who logs in on two devices, or clears cookies, stays in one arm.
- Minimum run time. At least one full business cycle, so weekday effects do not masquerade as results.
- Exclusions, written down. Bots, internal traffic, QA accounts, and anything that should have been filtered before launch.
Exposure deserves the arithmetic. Suppose a change lifts completion by 10 percent among users who reach the exposure point, but only 30 percent of randomized users ever get there. Your overall effect is 0.3 × 10 percent, or about 3 percent. That is a third of what a naive test plan assumed, and it can triple the sample size you need.
The fix is to fire the trigger at the exposure point rather than at the end of the funnel, so users who never saw the change never enter the analysis. Triggers placed this way commonly shorten tests by 30 to 60 percent. If your randomization happens at the top of the funnel but your metric fires at signup, you have built dilution on purpose.
Protect the assignment from the rest of the world. A discount campaign that runs on one arm, a targeting change mid-flight, a bot attack, or a cache that flickers between variants will all break the comparison. Freeze unrelated changes for the duration, or accept that your test is now confounded.
Validate the test before reading the outcome
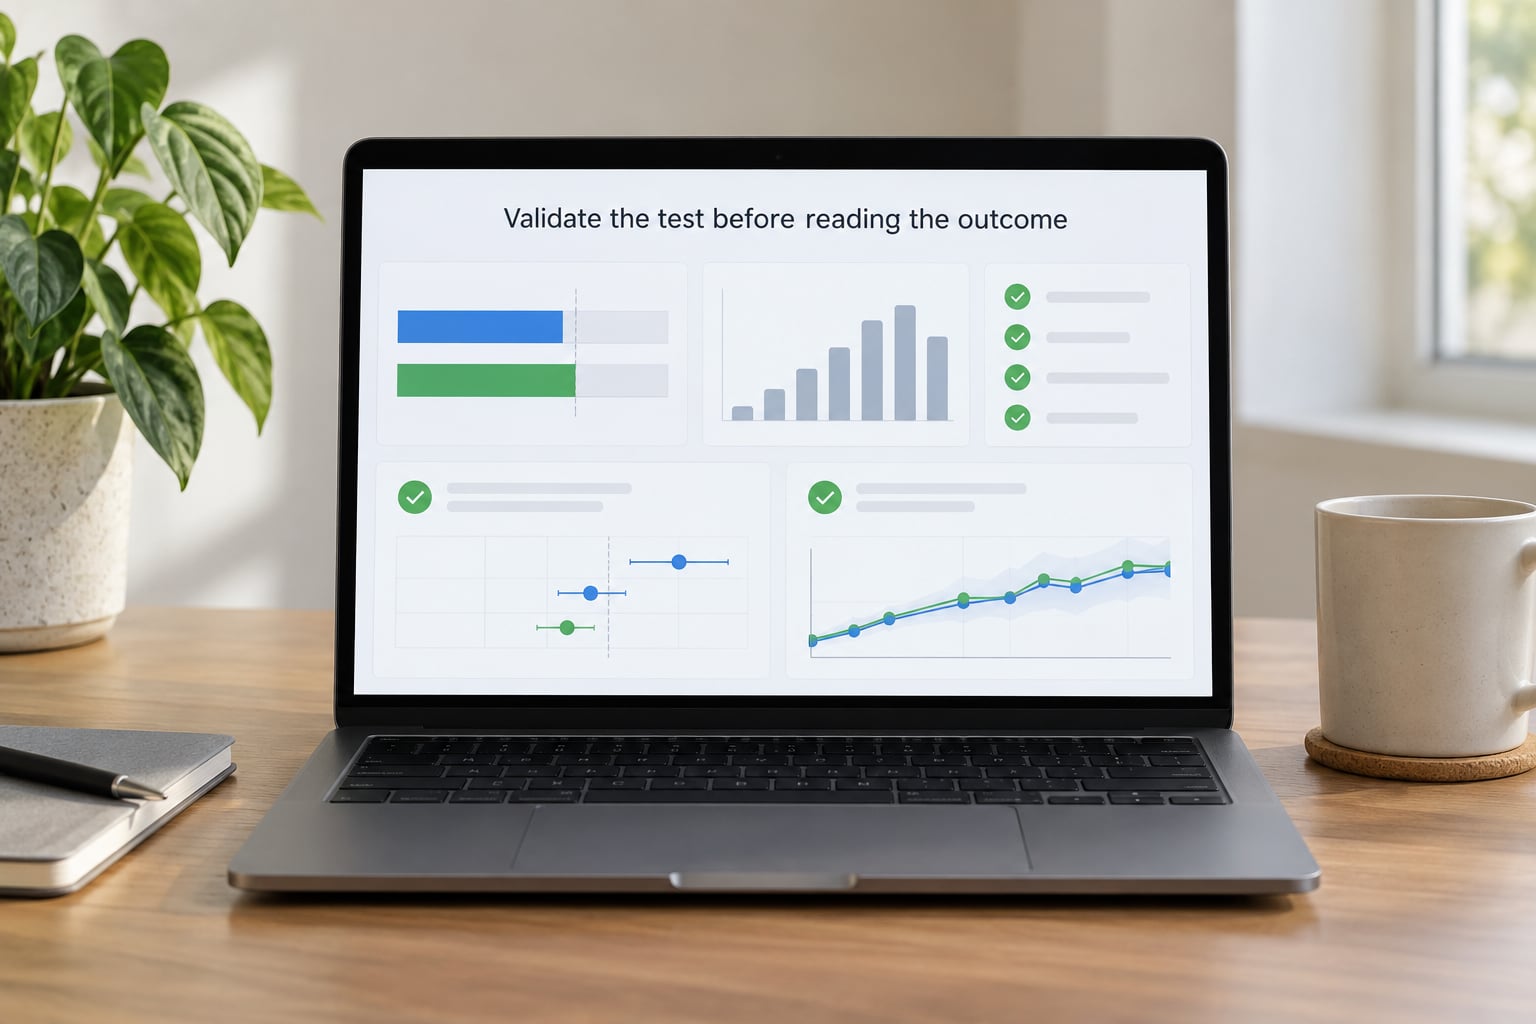
Run a data-quality pass before you look at lift. This takes ten minutes and catches the failures that otherwise get read as results.
- Sample ratio mismatch. The observed split should match the intended split closely. A 50/50 test that lands at 52/48 is not automatically broken, but 60/40 means something failed in assignment, exposure or logging.
- Instrumentation. Confirm the primary metric fires once per user per condition, that both arms use the same event definition, and that the treatment arm is actually receiving the change.
- Allocation balance. Check that pre-exposure characteristics, device split and geography look similar across arms. Big gaps mean the randomization is not clean.
- Cross-exposure. Users seen in both arms should be near zero.
- Novelty decay. Plot the daily effect. A spike in week one that fades is a novelty effect, not a durable change.
If a test fails these checks, diagnose it. Do not interpret a small p-value from a broken experiment, because the p-value only tells you the arithmetic worked, not that the arithmetic measured what you think it measured.
Analyze the result and estimate the uncertainty
Compare arms with a method that matches your design: a two-proportion test for simple conversion, a t-test or regression for revenue-like metrics, cluster-robust methods when randomization was clustered. Whatever you use, report the effect size with a confidence interval, not just a verdict.
The interval is the part people skip, and it is the part that carries the meaning. A lift of 4 percent with a confidence interval from minus 2 to plus 10 percent is compatible with harm, with nothing, and with a good win. That is a very different situation from an interval from 3.5 to 4.5, even though both are “significant.”
Then separate two different kinds of significance. Statistical significance says the effect is unlikely to be zero noise. Commercial significance asks whether the effect is large enough to matter once you weigh effort, risk and opportunity cost. A confident 0.3 percent lift on a low-value action can be statistically clean and commercially irrelevant.
Handle four things carefully before you conclude:
- Subgroups. Segment analysis multiplies your comparisons, so most segment “wins” in underpowered tests are noise. Pre-register the segments you care about, and treat everything else as exploration.
- Multiple comparisons. Every additional metric you test at 95 percent confidence adds roughly a 5 percent chance of a false positive per test. This is why the primary metric is singular.
- Novelty and timing. If the effect appears in the first three days and decays, you have measured curiosity.
- Null results. A non-significant result is not proof of no effect. It means the test was not precise enough to distinguish the true effect from zero, and the interval tells you how big an effect is still plausible. That is a useful, reportable finding, not a failure.
If you must monitor continuously rather than wait for a fixed horizon, use a method built for it, such as sequential testing with an alpha-spending rule. Peeking at a fixed-horizon test every morning and stopping at the first p-value below 0.05 inflates your false positive rate far above the nominal 5 percent. That habit is the single most common way a team ships a change that does not work.
Make and document the decision
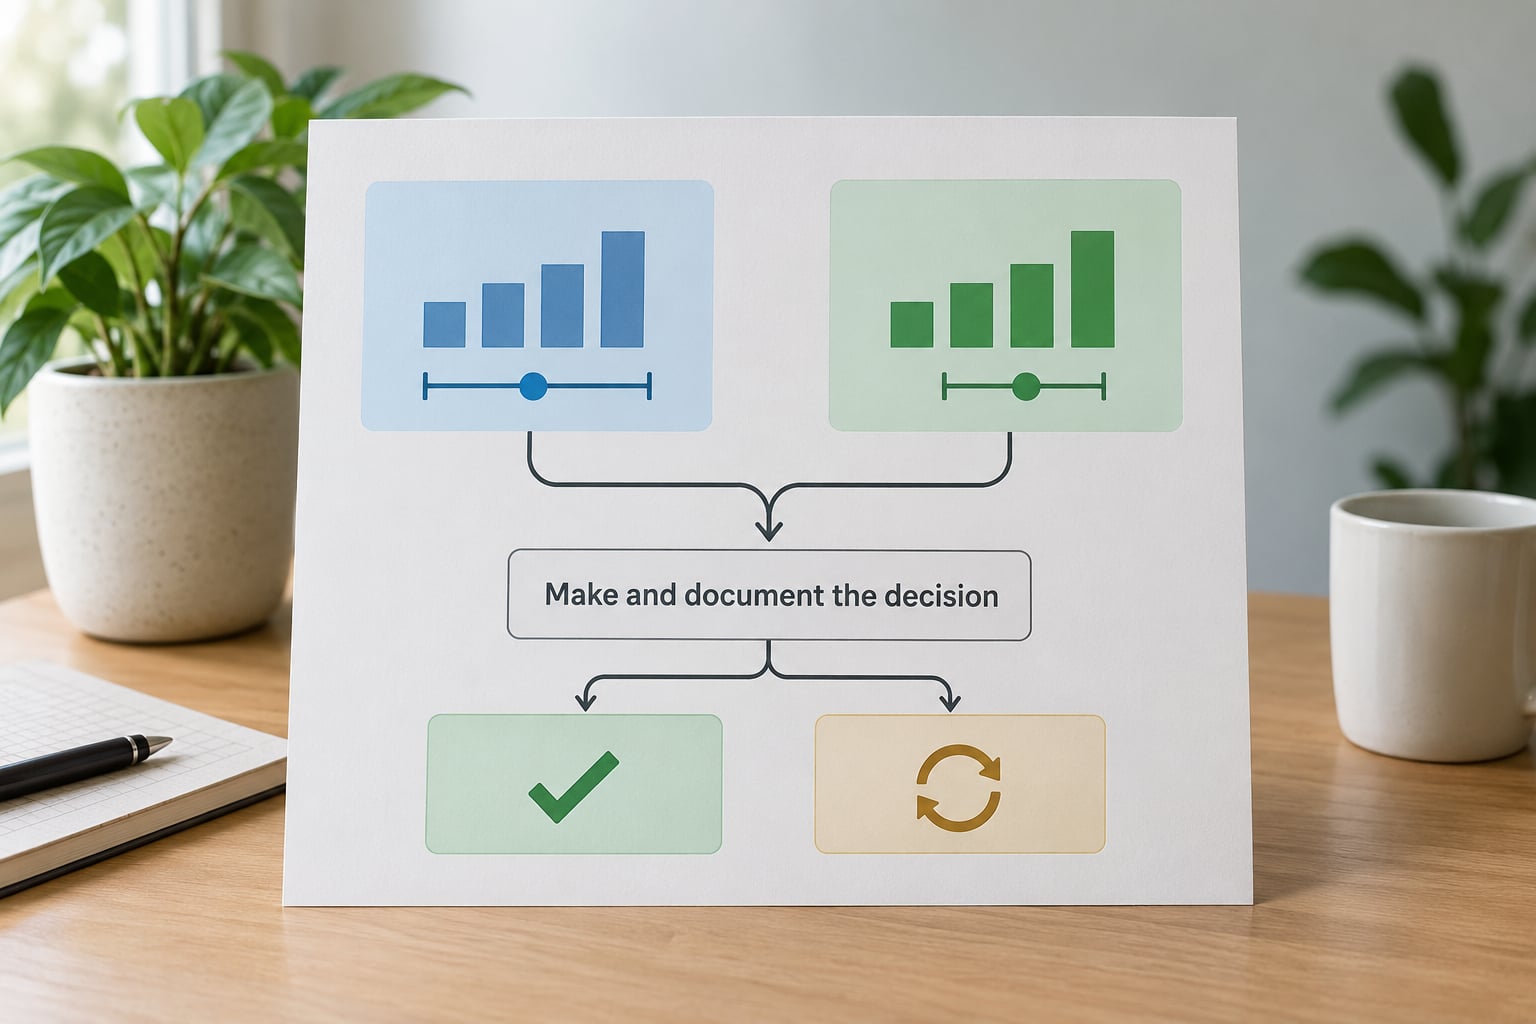
Map the result onto the decision rule you wrote before launch. Most teams should have four outcomes, not two: adopt, reject, iterate, or run a different test. A flat result with a clear diagnostic story belongs to “iterate,” not to “ship the control and close the ticket.”
Write the record while it is fresh: the question, the hypothesis, the exposure definition, the metric tree, the required sample and the stopping rule; then the result, the interval, any guardrail movement, any segment effect you pre-registered, the decision, and the next action. This is what an insights repository is for, and it exists for one reason: so nobody spends a quarter re-running the test you already ran.
On adoption, decide what happens after the readout. Ship to everyone and stop measuring, or keep a small holdout running to catch effects that only appear over months, like churn, refund rates or repeat purchase. The holdout is unglamorous and it is the only way to find out whether the win held.
One more habit compounds: close the loop with whoever asked. A test that answered the original question and told the requester why is worth far more than the lift itself, and it is what buys you the right to run the next test on a question instead of an opinion.
Common A/B Testing Mistakes
These are the failures that show up most often, and each one is cheap to avoid at design time and expensive to discover afterwards.
Testing without a decision. A test with no stated consequence produces a number nobody acts on. Fix: write the decision, owner and deadline before anything else. Tip: if you cannot say what changes if the treatment wins, cancel the test.
Changing several things at once. Bundled variants tell you the package works, not which part did. Fix: one deliberate change per treatment, or explicitly frame the test as a package evaluation and drop the causal claims about elements. Tip: if a designer wants three changes, run three tests or accept a longer roadmap.
Peeking and stopping at significance. Watching daily and stopping the first time the number crosses 0.05 inflates false positives dramatically. Fix: a fixed sample and fixed end date written before launch. Tip: hide the results dashboard from the people who want to see it until the stopping point.
Choosing the metric after seeing results. You will find a metric that flatters the winner. Fix: name one primary metric up front and report the others as diagnostics. Tip: write the metric definitions into the design doc so they cannot be quietly redefined later.
Underpowering the test. A test that cannot detect the effect you care about cannot answer the question, and a null result gets misread as “no effect.” Fix: run the sample size calculation first and compare to traffic honestly. Tip: when the required sample exceeds your window, raise the MDE on purpose rather than quietly underpowering.
Ending too early. Weekday, pay-cycle and campaign effects produce swings that vanish with more data. Fix: a minimum duration of one full business cycle, plus a week where relevant. Tip: plot the daily effect and look for decay before you trust a headline number.
Ignoring sample ratio mismatch. An uneven split usually means broken assignment, broken exposure or broken logging, and the comparison is not trustworthy. Fix: check allocation before lift, every day. Tip: a continuous SRM check catches this in hours instead of weeks.
Overinterpreting segments. Cutting results by device, country or plan multiplies comparisons and manufactures false winners. Fix: pre-register the segments that could block a rollout, and label everything else exploratory. Tip: ask what number of users a segment would need before believing it.
Ignoring dilution. Randomizing people who never reach the exposure point inflates your required sample and shrinks the observable effect. Fix: define the exposure point and trigger the metric there. Tip: work out the exposed share before launch; 30 percent exposure turns a 10 percent lift into roughly 3 percent.
Running the same test twice. No shared record of past experiments, so teams re-litigate settled questions. Fix: keep a short test log with the question, the result and the decision. Tip: search the log by surface, not by wording, before any new test enters the backlog.
Frequently Asked Questions
How long should an A/B test run before checking results?
Run until the pre-registered sample is reached, with a minimum of one full business cycle so weekday patterns do not distort the result. A common starting point is two weeks, but traffic decides: divide the required sample by two and then by daily eligible traffic to get the duration. Treat any interim look as monitoring only, not as permission to stop early.
What sample size do I need for a reliable A/B test?
It depends on your baseline conversion rate, the smallest effect you care about detecting, your confidence level and your power target. Enter those four into a sample size calculator and you get the number of users needed per arm. Compare that to your daily eligible traffic before committing. A 95 percent confidence level and 80 percent power are conventional starting points.
Can I test more than two variations in one experiment?
Yes, most platforms support several arms, but every extra arm costs sample size and you lose the clean pairwise comparison a two-arm test gives you. Use multiple arms when you genuinely have several credible candidates and enough traffic, and correct for the extra comparisons when you analyze. With limited traffic, two arms will reach significance sooner and tell you more.
When should I segment A/B test results by audience?
Segment when a subgroup could reasonably block the rollout, such as a customer segment that might see a price increase or lose access to something they use. Pre-register those segments before launch and give each one a threshold. Everything you cut after seeing the data is exploratory and should be reported as a hypothesis for the next test, not as a finding.
Why is my A/B test showing no significant result?
Most often the test was underpowered for the effect you were hoping to see, which makes a real difference invisible rather than absent. Other common causes are dilution from a late exposure point, contamination between arms, a short duration that catches a weekly cycle, or a primary metric that is not actually tied to the decision. Check allocation, exposure and the confidence interval before drawing conclusions.
What should I do if my treatment wins but guardrail metrics fall?
Treat it as a trade-off, not a win, and report it that way. Quantify the harm in units the business cares about, such as extra support contacts or refund requests, and compare that cost against the primary gain. Then use your decision rule: ship with a mitigation, ship only to a segment where guardrails hold, roll out gradually with monitoring, or reject the change.
Conclusion
A useful experiment begins with a decision, defines a credible comparison and one primary outcome, and sets its stopping condition before a single user is exposed. Get those three right and most of the classic mistakes stop being possible.
Start today by writing the one-page record: the decision and its owner, the rewritten question, the control and treatment, the primary metric plus guardrails, the MDE and required sample, and the rule you will follow in each outcome. That single page is the difference between how to design an A/B test that answers a real question and another quarter spent arguing about a button color.