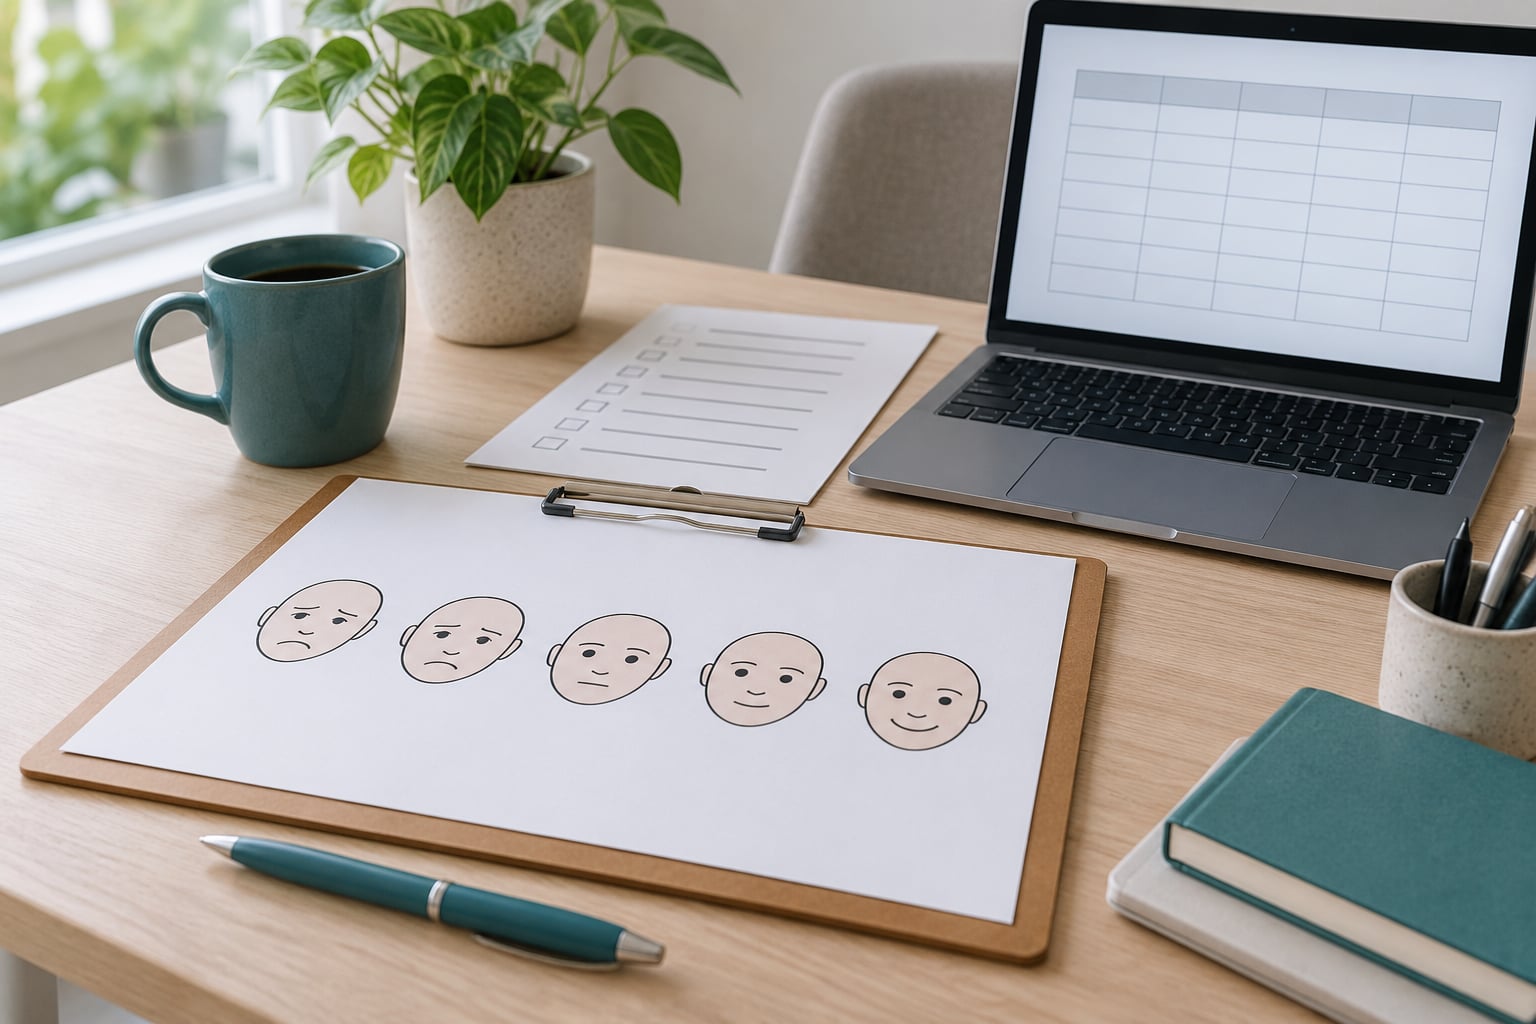
To capture feelings with images, you show a participant an ordered set of faces, figures, symbols or a picture-ended line, and they respond by pointing, marking or selecting rather than by choosing a word from a list. That single action becomes a number you can group, chart and compare. The procedure below takes about two hours of setup for a first study, plus ten minutes per participant.
The reason to bother is a specific failure mode. People are not great at naming their own feelings in the moment, and a questionnaire that says “rate your comfort from 1 to 7” asks them to do the naming first and the rating second. When the naming fails, the number is meaningless. Removing the words sidesteps the problem.
What you get is not a reading of the participant’s inner life. It is a fast, comparable, non-verbal self-report that a mixed sample can complete in seconds, including people who do not read your survey language fluently. Treat it that way and it is one of the most practical instruments in research methods. This guide walks through the whole cycle: choosing a scale, building the image set, piloting it, asking it in neutral language, and reading the results without overreaching.
Table of Contents
- What You Need
- Step-by-Step: How to Use Image Based Scales to Capture Feelings
- 1. Define the Feeling You Need to Measure
- 2. Choose the Right Image-Based Scale
- 3. Select Images That Represent a Clear Intensity Order
- 4. Test the Scale With a Small Pilot
- 5. Ask the Scale in a Neutral, Repeatable Way
- 6. Analyse Responses by Emotion, Segment, and Context
- Common Mistakes
- Frequently Asked Questions
- What is an image-based scale for measuring feelings?
- How many pictures should be used on a feelings scale?
- Are image-based scales suitable for children or people who cannot read?
- How can I make a pictorial scale culturally appropriate?
- What is the difference between an image scale and a Likert scale?
- Should I combine an image-based scale with interviews or open-ended questions?
- Conclusion
What You Need

You need six things before the first participant sits down: a research objective narrow enough to state in one sentence, a scale that measures that specific construct, a defined audience, written instructions that do not lead, a way to record each response, and a plan for analysis decided before you see any data.
That last item matters more than teams expect. Decide how you will handle missing answers, how many points you will treat as distinct, and what difference would actually change a decision, all while you have no results to be tempted by.
The construct check comes first, because most disappointing image scale results trace back to measuring the wrong thing. Four words get used interchangeably and should not be.
- Emotion is a short, intense, stimulus-linked state. Annoyance at a checkout flow is an emotion.
- Feeling is the participant’s own conscious report of that state, which may be vague, blended or absent.
- Association is what a stimulus brings to mind, such as a childhood kitchen, with no emotional charge at all.
- Satisfaction is a judgement about performance against expectations, not a feeling in itself.
These produce different pictures. Satisfaction ratings cluster near the top of any scale because people rarely give themselves a failing mark. Emotions spread out. If your real question is “does this product feel exciting or calm”, you are measuring emotion and should say so in your write-up rather than calling the result satisfaction.
One more prerequisite deserves a mention. If you plan to print the scale, print it at a fixed physical size and check it on the actual device you will use. Scales shrink on a phone screen and reorder on a laptop, and a re-ordered scale produces different answers. If you need a large wall display, render the image at the physical dimensions you intend, rather than stretching it later.
Step-by-Step: How to Use Image Based Scales to Capture Feelings
1. Define the Feeling You Need to Measure
Write the objective as one measurable sentence: “After viewing the new packaging for 20 seconds, how strongly does the participant feel calm?” A broad brief like “reaction to the new package” is not yet a measurement, and it will produce a survey that measures several things badly rather than one thing well.
Then fix four things in that sentence: the audience, the stimulus, the comparison condition and the decision the answer informs. “Calm” among current customers, shown the new pack for 20 seconds, compared against the incumbent pack, to decide whether to proceed to shelf testing. Each of those four choices changes what the numbers mean.
Check that the step worked by reading the sentence to someone outside the project. If they ask a question you could not have answered, something is still vague. One emotion per question is the safe default; a deliberate exception is a multi-emotion profile, where you ask the same stimulus on several separate scales and read the pattern of mixed responses.
2. Choose the Right Image-Based Scale
Match the format to the population and the question, not to what looks nice in a report. Each format below is a different measurement with a different failure mode.
- Pictorial emotion scales show a row or grid of faces or characters and ask the participant to pick one or several. PrEmo, developed by Pieter Desmet at Delft University of Technology, uses cartoon characters to express 14 emotions and was built specifically to pick up subtle, low-intensity and mixed feelings that verbal questionnaires flatten.
- Abstract manikins show simple human figures whose posture and expression change along a dimension. The Self-Assessment Manikin, from Bradley and Lang in 1994, is the standard example: it rates pleasure, arousal and dominance, the three axes of the PAD model, without using a word at all.
- Visual analogue scales are a line, usually 10 cm long, with picture or word anchors at each end. The respondent marks a point on the line; scoring is the distance in millimetres. The format comes from Zealley and Aitken in 1969, who used it to measure mood.
- Sliders and grids such as EmojiGrid arrange emoji in a two-dimensional plane, so position itself carries the meaning rather than a label.
- Custom icon sets cover situations no published scale fits, usually a product, a service moment or a specific cultural context.
A common mistake is defaulting to a Likert scale out of familiarity. Likert items are fine when you need validated norm comparisons, and a poor substitute when your participants are children, speak another language, or are being asked mid-task for a second time. If you have to defend the choice, name what the other option would have cost you.
Check the step worked by confirming the scale’s published use matches your population. An instrument validated on university students tells you very little about how a 70-year-old shopkeeper or a nine-year-old child will read it.
3. Select Images That Represent a Clear Intensity Order
An ordered set only works if the order is real. If three of your five faces sit at the same intensity, you have built a five-point scale with three points, and your participants will guess. This is where most custom sets quietly fail.
Hold five variables constant across the whole set: illustration style, character age, gender presentation, viewing angle, colour saturation and level of visual detail. The only thing that should change is the emotion. A set where one face is a photograph, one is a flat cartoon and one is an emoji is measuring rendering style as much as feeling.
Bias enters through the character. A cartoon man expressing distress reads differently in different places, and a designed face can carry a racial, age or gender stereotype that respondents respond to instead of to your scale. Check your set with people outside the sample, and describe it to a colleague in one sentence per image, without using an emotion word. If their descriptions cluster at the same intensity, your ordering needs work.
Endpoint labels matter as much as the pictures. A scale that runs from a relaxed face to a strained face measures relaxation and strain. A scale that runs from a bored face to a delighted face measures something else entirely, and the two cannot be reported as the same construct. Decide the direction and write it down before anyone sees the scale.
Finally, keep the set printable. A custom set that only works on a colour phone screen loses you every participant on a paper form, and paper forms are how you get older and lower-literacy samples. When you have the set settled, it is time to check the third step worked: every respondent should be able to describe your images in the same emotional order without being prompted.
4. Test the Scale With a Small Pilot
Run a pilot with five to ten people before you run the study. Five is enough to expose obvious confusion; ten is enough to start seeing a pattern in which image gets chosen and why.
Watch people complete it silently. You are looking for hesitation, re-reading, and choices where the person moves to an image and then back. Record every moment they ask what something means, because those exact questions are the ones your written instructions fail to answer.
Also ask each person to name the emotion in their own words after choosing. Where the words cluster but the images scatter, your intensity order is not reading correctly. Where the words scatter but the images cluster, you may have a scale that is doing its job of catching feelings people cannot articulate, which is a good outcome, not a flaw.
How to score it: count how many pilot participants picked each image. Any point with very few selections is either confusing or not part of the range your participants actually experience, and both reasons mean it should change. A point that takes 80 percent of responses is a ceiling, and a scale with a ceiling cannot show you improvement next time.
The step is done when a participant can complete it without a single clarifying question and when no image is chosen by almost nobody. Revise the ambiguous endpoints and labels, then pilot the revision. This is the stage where you are supposed to find problems, and a pilot that finds nothing usually means the pilot was too small or too friendly.
5. Ask the Scale in a Neutral, Repeatable Way
Wording carries respondents toward an answer, and a picture scale is no protection against it. Show the same stimulus, the same order, the same exposure time and the same environment to every participant, and keep the instruction short and identical each time.
Here is wording that works: “Look at this image. Then choose the face that shows how you felt while looking at it.” Then: “Choose one. You may use the comment box if you want to say more.” No mention of the word you expect, no “how did you like it”, no reassurance that any answer is acceptable, and no explanation of what the scale is for.
Two response modes behave differently. In a forced-choice format the participant picks exactly one image, which gives you a clean distribution but hides intensity, because everyone who feels something mildly lands in the same bucket. In a rated format they pick and then rate the strength, or mark a position on a line, which keeps the intensity information at the cost of more effort per item.
Run the same scale twice on a subset of participants when you can. A picture scale that reorders randomly between administrations is telling you about measurement error, and finding that out on five people costs a morning rather than a fieldwork budget.
A comment field beside the scale is worth adding even when you do not plan to analyse it. Ten open comments will tell you which image your set needs, and they are the fastest route to a quote that makes a report land.
6. Analyse Responses by Emotion, Segment, and Context
Turn each response into a number: the item index for a pictorial scale, the distance in millimetres along a visual analogue line, or the row and column for a grid. Then compute proportions per image for categorical scales, and means and distributions for line or slider data.
Segment before you conclude. If calm reads as neutral overall, look again by category, by familiarity with the stimulus, and by whether this was a first or second exposure in the session. Most flat results are a real average of two opposite groups, which is a finding rather than a failure.
Watch for the four things that signal a broken study. Missing responses concentrated on one image mean that image is unreadable. Straight-lining, where someone picks the same position on every question, usually means the task was repetitive or unclear. Ceiling and floor effects, where nearly everyone picks the same image, tell you the range is wrong. And a sudden break in the data partway through usually means something changed in the environment rather than in the participants.
Visual preferences are not emotional responses. Somebody choosing the prettiest face has told you about aesthetics. You can keep that data, but label it as preference, and do not report it as comfort, excitement or trust.
Plot results on a two-dimensional map when your scale has two dimensions. SAM gives you pleasure against arousal directly, and plotting the group means shows where a design lands and how far apart two concepts are. A design at high pleasure and low arousal is a different proposition from the same pleasure at high arousal, and the numbers alone do not tell you which one you have.
One caveat to carry into every report: the result is ordinal unless the instrument’s documentation says otherwise. A mark at 70 mm is not twice as far from neutral as a mark at 35 mm in any meaningful sense. Report medians and distributions, compare groups rather than treat single values as arithmetic quantities, and say so plainly when a stakeholder asks for an average score.
Common Mistakes
These six errors account for most of the disappointing image scale results I have seen, and each has a straightforward correction.
Using vague emotion words in the instruction. “How do you feel about this?” collects whatever the participant supplies, which for many people is a general impression. Replace it with a specific verb and a time frame: “how calm you felt during the first 20 seconds”. If you cannot write the feeling without a vague word, you have not finished defining the construct.
Mixing unrelated feelings in one scale. A set running from sleepy to delighted mixes arousal and valence, and a respondent choosing the sleepy face is not saying they were bored. Split them into two scales and read them separately, or accept that you are measuring a composite and name the composite in your report.
Changing the images between questions. Reusing one pleasant face across every item is tempting and quietly fatal, because the participant starts answering from memory of the last question rather than from the current stimulus. Use a matched set where each item has its own set with the same order and style, or randomise presentation consistently across all participants.
Copying culturally inappropriate stock faces. A facial expression that reads as frustration in one market may read as concentration in another, and stock libraries carry the stereotypes that make this worse. Use sets validated across the populations you are studying, or run a small comprehension check per market and report it.
Forcing every answer into too few points. Three points cannot represent a feeling that is present but mild, which is exactly the low-intensity region these scales exist to catch. Five to seven ordered points is usually the practical minimum, and seven is better when the response is subtle.
Reading descriptive preferences as universal truths. “Most participants picked the bright image” is a statement about the sample, the day and the stimulus. Write “in this study, under these conditions” and resist the sentence “consumers prefer bright packaging”, which is a claim your instrument cannot support.
A few things that reliably improve the work. Randomise the screen order of image sets while keeping the intensity order inside each set fixed, and record which order each person saw. Keep the whole task under five minutes; attention drifts fast in this format. Train observers to the same script if anyone is reading responses aloud. And if you are running a concept test, collect the image response before you let anyone discuss the concept, because discussion turns a feeling into an argument.
Frequently Asked Questions
What is an image-based scale for measuring feelings?
An image-based scale is a measurement instrument where respondents report how they feel by pointing to, marking or selecting pictures instead of reading verbal rating questions. Faces, figures, cartoons, or a line with picture anchors all qualify. You show the scale with the stimulus, the participant makes one deliberate response, and you convert it into a number for analysis. Because the response needs no vocabulary, it works across languages and literacy levels.
How many pictures should be used on a feelings scale?
Five to seven ordered points is the practical range. Three points is too coarse to capture mild but real feelings, and more than nine makes the ordering hard to judge and the task slow. Published instruments tend to fall in this band: SAM uses a nine-point manikin per dimension, and PrEmo presents 14 emotions as a character set rather than one ordered row. Always pilot the set and drop any point almost nobody selects.
Are image-based scales suitable for children or people who cannot read?
Yes, and that is one of their main advantages. Because the response is a point, a tap or a mark on a line rather than a word, participants need only enough comprehension to follow the task, not enough literacy to read a statement and judge a word like comfortable. Studies with children and with populations whose first language is not the survey language use them regularly. Keep instructions short, read them aloud where permitted, and pilot with the actual age group.
How can I make a pictorial scale culturally appropriate?
Start from a set with published cross-cultural validation, such as PrEmo, rather than assembling stock faces yourself. If you must adapt, check with participants in each market what each image communicates before using it in data collection, and treat that check as a comprehension exercise, not a preference one. Watch for gender, age and skin tone stereotypes baked into the characters. Document every change you make, since an adapted set is a new instrument.
What is the difference between an image scale and a Likert scale?
A Likert scale asks the respondent to read a statement and choose a level of agreement or frequency, so measuring the feeling requires reading, understanding and naming it. An image-based scale replaces the verbal statement with a picture, and the response becomes a choice of image or a mark on a line. Likert scales have the advantage of existing norms and mature validation. Image scales are faster, language-light and better at catching mild or mixed emotion.
Should I combine an image-based scale with interviews or open-ended questions?
Yes, and the pairing is cheap. The scale gives you numbers you can compare across participants and versions, while a short comment field or follow-up question gives you the reason behind a choice. Ask the scale first, then ask why, so the verbal answer does not lead the pictorial one. In usability testing, pairing the scale with think-aloud observation and physiological measures such as electrodermal activity or pupil dilation lets you check the self-report against behaviour.
Conclusion
Start with one feeling, stated tightly enough that you could tell whether a participant had it. Pick an instrument that already measures that construct, or build a matched set of five to seven images with a single variable changing. Pilot it with five to ten people, watch them complete it silently, and revise whatever they hesitate over. Then ask it in identical words, score it, segment it, and report it as ordinal data gathered under specific conditions.
Image-based scales capture feelings well when design, administration and interpretation are treated as one job. The instrument is the easy part; the discipline is in the images you choose, the wording you keep neutral, and the restraint you show when the numbers come back.