
To run a behavioral science experiment in marketing, you write a falsifiable hypothesis about a real human decision, split your audience randomly into a control and one or more treatments, and measure an outcome until you have enough data to trust the result. The whole process takes about two to six weeks for a typical website test, and the hard part is rarely the tooling. It is resisting the urge to change things halfway through.
Most teams do this badly for predictable reasons. They pick a clever headline, ship it, watch the conversion rate move, and call it a win without ever checking whether the movement was distinguishable from noise. That produces confident decisions built on nothing.
Table of Contents
- What You Need
- Step-by-Step: How to Run a Behavioral Science Experiment in Marketing
- 1. Turn a marketing problem into a behavioral hypothesis
- 2. Choose the right outcome and guardrail metrics
- 3. Design the treatments and control condition
- 4. Randomize and define the audience before launch
- 5. Calculate a realistic sample and test duration
- 6. Run a clean pilot before the main experiment
- 7. Execute the experiment without changing the rules
- 8. Analyze the results and decide what they mean
- 9. Apply the learning and document the decision
- Common Mistakes
- Frequently Asked Questions
- What is the simplest behavioral science experiment a marketing team can run?
- How many customers do I need for a marketing experiment?
- Should I run an A/B test or a multivariate behavioral experiment?
- How long should a behavioral marketing experiment run?
- What does statistical significance mean in a marketing experiment?
- How should a marketing team handle an unexpected or negative result?
- Conclusion
What You Need

Before you open a testing tool, get eight things settled on paper. Skipping any of them is how experiments end up answering a question nobody asked.
- A specific research question. Not “improve conversion” but “does showing a delivery date on the product page reduce abandonment among first-time visitors.”
- A defined target audience. Who is in the test, who is excluded, and where the boundary sits.
- The decision the experiment informs. If no one is going to act on the result, don’t run it.
- Realistic budget and time. Sample size, traffic, and the number of weeks required are linked, and you need all three before launch.
- A test environment you can control. Somewhere you can vary one element and hold everything else steady.
- A behavioral mechanism. The specific bias or principle you believe is driving the behavior: social proof, loss aversion, cognitive fluency, anchoring, and so on.
- One primary outcome metric. A single behavioral measure, chosen before any data arrives.
- Tools for randomization, delivery, and analysis. An experimentation platform, or an A/B testing tool paired with your analytics and tag manager.
Step-by-Step: How to Run a Behavioral Science Experiment in Marketing
1. Turn a marketing problem into a behavioral hypothesis
Start from a behavior you have actually observed, then attach a mechanism to it. A behavior is something a person does: adds an item to a cart, abandons a form at the second field, opens an email but never clicks. The mechanism explains why.
A usable hypothesis is falsifiable and names the intervention, the audience, and the outcome: “Adding a one-line testimonial from a named customer to the checkout page will increase completed purchases among first-time buyers, because social proof reduces the perceived risk of an unfamiliar brand.”
The common failure is a hypothesis you cannot lose. “Customers will like the new offer” tells you nothing, because any result can be argued into agreement. Success check: someone who disagrees with you could look at the sentence and tell you exactly which number would prove you wrong.
2. Choose the right outcome and guardrail metrics
Pick one primary metric tied to the hypothesis and the business decision. Secondary metrics explain the mechanism. Guardrails protect things you are not willing to trade away.
For a checkout test, the primary metric might be purchase completion rate. Secondary metrics could be time on the checkout page and the number of form validation errors. Guardrails typically include refund requests, support contacts about the new element, and overall revenue per visitor.
Guardrails matter because local wins hide global damage. A nudge that lifts completion by 4% but doubles post-purchase complaints is a net loss, and you will only see it if you were measuring for it. Success check: you can name exactly one number that decides the outcome, chosen before launch.
3. Design the treatments and control condition
Your control is what runs today. Treatments vary one thing. If you change the headline, the image, and the button colour at once, a lift tells you that something worked, not what, and the learning is unusable.
Execution has to be consistent too. If treatment A shows the testimonial to everyone and treatment B shows it only to mobile users, your comparison measures device, not messaging. Keep placement, timing, tone, and rendering identical across arms.
Exposure conditions should mirror reality, including slow connections and small screens. Success check: you can describe each arm in one sentence and name the single factor that differs.
4. Randomize and define the audience before launch
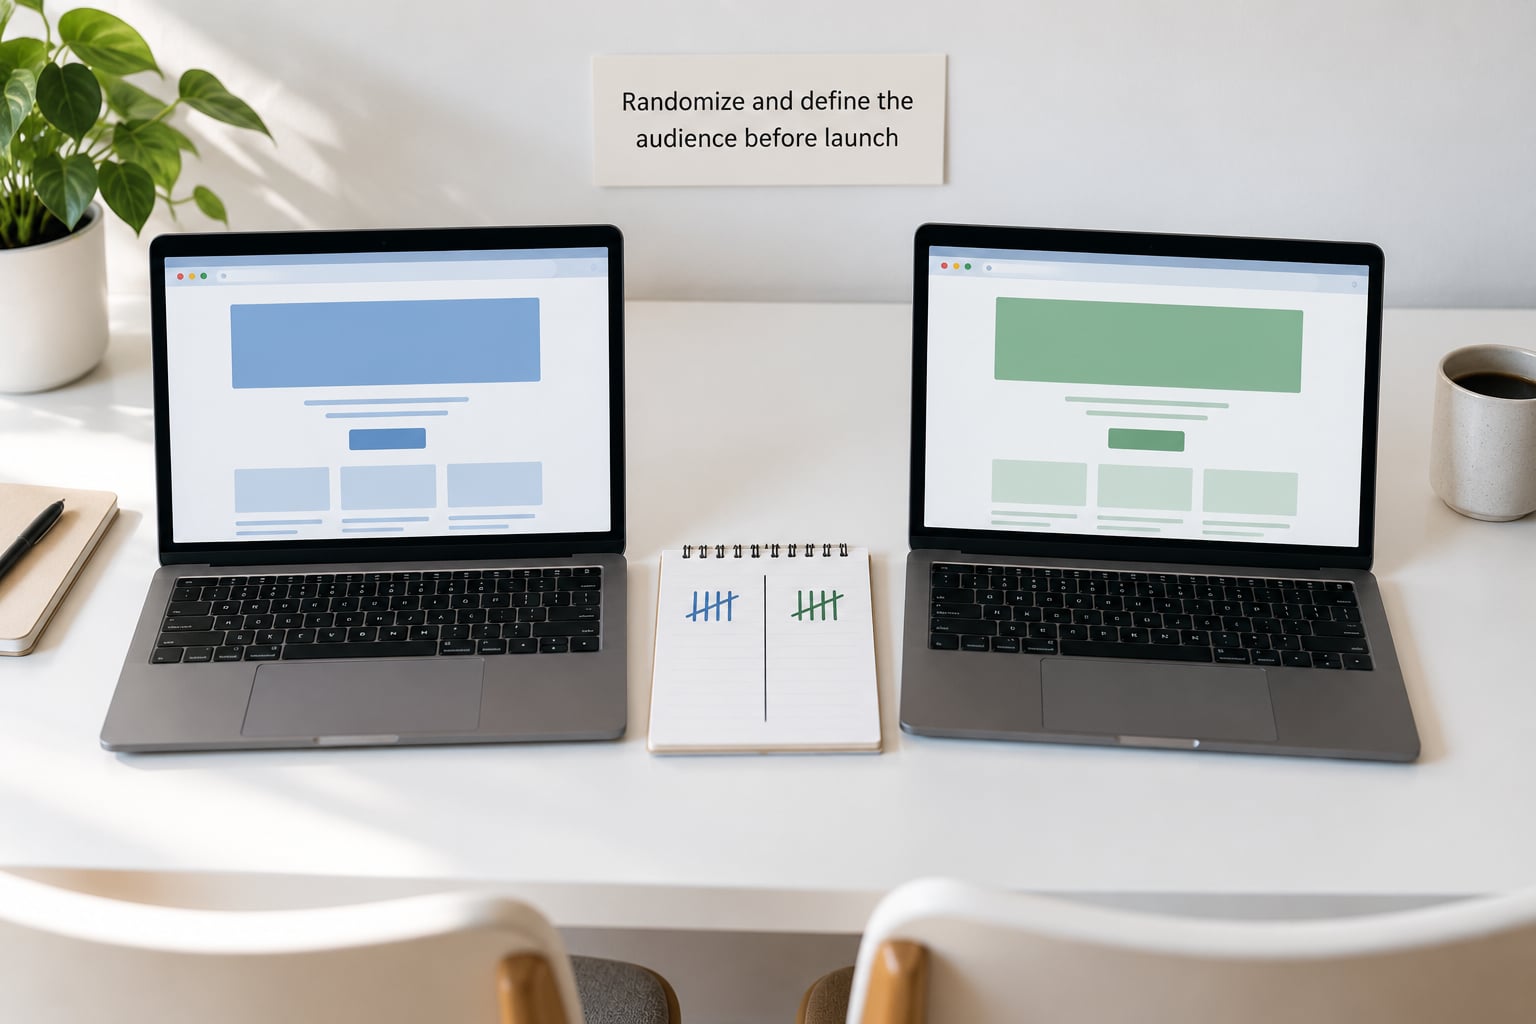
Random assignment is what makes the comparison fair. Eligible visitors should be allocated by chance, not by arrival time, device, geography, or anything correlated with the behavior you are studying. Even allocation across arms protects against day-of-week drift.
Write the eligibility rules down before launch: returning visitors only, new visitors only, one country, exclude employees and known bots, exclude users in other running tests if that creates interference. Watch for contamination, where a control user sees the treatment somewhere else, such as an email that links to the variant.
Success check: the population and the randomization method are documented in a pre-launch note, and no one has adjusted either one after peeking.
5. Calculate a realistic sample and test duration
Sample size comes from five inputs: baseline conversion rate, the smallest effect you care about, desired power, the significance threshold, and expected attrition. A conversion-proportion calculator gives you a number in seconds, and most marketing tools have one built in.
The smallest effect you care about matters most. Chasing a 2% relative lift with a 2% baseline means very large samples and very long tests. Most teams find it cheaper to run several smaller, well-scoped tests than one heroic one.
Duration should cover whole weekly behavior cycles, because weekend and weekday traffic behave differently. Two full weeks is a common floor for anything less than high volume, and calendar or payday effects matter more in B2B than in e-commerce. Success check: you know your required sample and your target end date before the test starts.
6. Run a clean pilot before the main experiment
Run the whole system on a small sample first. Verify that assignments are balanced, that each variant renders correctly on mobile and desktop, that the treatment actually reaches users, and that your metric fires where it should.
Resist reading outcome differences during the pilot. You are checking plumbing, not performance. If you look at lift during the pilot and keep the pilot because it looked good, you have started a test with a selection bias baked in. Success check: tracking, exclusions, and variant rendering are confirmed by someone who did not design the test.
7. Execute the experiment without changing the rules
Pre-register the design: hypothesis, arms, primary metric, guardrails, sample size, end date, and analysis method. If you write the analysis plan after seeing the data, you will find a way to make almost any result look meaningful.
During the run, log exposures, watch for instrumentation failures, and handle incidents under a written rule. If something breaks, decide in advance whether you restart the test or exclude the affected window, and record which. Stopping early to catch a win is the single most common way teams manufacture false positives, because random noise produces winners if you keep rolling dice.
Success check: the end date passes with the original rules intact and a log of any operational changes.
8. Analyze the results and decide what they mean
Analyze by assigned group, not by who actually saw the variant, which is the intention-to-treat approach. Then look at the absolute difference and the confidence interval, not just the pass or fail verdict. A 95% confidence interval that runs from minus 1% to plus 4% means the truth could plausibly be a loss.
Check guardrails before celebrating, then check whether the effect size is commercially meaningful. Statistical significance and practical significance are different questions, and a tiny reliable lift is often not worth the maintenance burden of a new variant.
Look at segments only as a hypothesis generator. A segment that appears to convert better after the fact, with no prior reason to expect it, is a lead for the next test rather than a finding. Avoid claims like “this proves psychology drives buying” or “this will lift revenue across the business.” One test on one audience on one channel supports a narrower statement. Success check: you can state the effect, the interval, the limits, and what you would do differently.
9. Apply the learning and document the decision
There are four honest outcomes: roll out, revise and retest, stop, or keep running for more data. A negative result is a real result, and it is worth more than a win you cannot trust.
Write it up: what you hypothesized, the mechanism you expected to work, what happened, the interval, guardrail results, who was in the sample, and what limits the conclusion. Future teams inherit that file instead of re-running the same test or, worse, believing an old result that no longer holds.
Success check: someone outside the team could repeat the test from your notes.
Common Mistakes
These are the errors that cost the most, with the fix beside each one.
- Changing several variables at once. Fix: one factor per treatment, or a factorial design you can actually afford to power.
- Stopping when a winner appears. Fix: fixed end date and sample, or a sequential method designed in advance.
- Ignoring novelty effects. A fresh page can pull clicks from curiosity that fade within weeks. Fix: re-run a winning variant later, or plan a holdout from the start.
- Cherry-picking segments after the fact. Fix: pre-specify the segments you care about, and treat everything else as exploratory.
- Underpowering the test. Fix: choose the minimum effect worth acting on, calculate honestly, and shrink the scope of the question if the sample is too small.
- Treating correlation as causation. Fix: if the test was not randomized, describe it as an association and say what would confirm it.
- Testing above the line of decision. Fix: measure what the business actually decides on, not an engagement proxy that rarely moves money.
- Writing the analysis after the results land. Fix: pre-register the metric, threshold, and method, and report what you pre-specified even if it is disappointing.
- Running tests with no owner. A test nobody acts on is a research project with extra steps. Fix: name the person who decides, before launch.
Frequently Asked Questions
What is the simplest behavioral science experiment a marketing team can run?
A single-arm test on one page element: a headline, a CTA label, or a social proof block on a landing page. Split traffic randomly, keep everything else identical, measure one outcome such as form completion, and run it for at least two full weeks. The simplicity is the point, because a clean single-factor test is one you can trust and actually finish.
How many customers do I need for a marketing experiment?
It depends on your baseline conversion rate and the smallest lift worth acting on, not on a fixed number. At a typical 2-3% conversion rate, detecting a 20% relative lift usually needs a few thousand visitors per arm. Plug your baseline and target effect into any conversion calculator, add room for attrition, and if the required sample is far beyond your weekly traffic, narrow the question instead of waiting months.
Should I run an A/B test or a multivariate behavioral experiment?
Start with an A/B test. It isolates one behavioral mechanism, needs a smaller sample, and gives you an interpretable result you can write into a playbook. Multivariate tests suit teams with high traffic who want to explore combinations rather than prove a single mechanism. Running multivariate first usually produces a winner you cannot explain, which is a result you cannot reuse.
How long should a behavioral marketing experiment run?
Long enough to reach your required sample and cover whole weekly behavior cycles, which usually means a minimum of two full weeks for anything under high traffic. Longer if your audience is small or if behavior depends on day of week, holidays, or a monthly billing cycle. Ending the test on a fixed date rather than when a result looks good protects against false positives.
What does statistical significance mean in a marketing experiment?
It means that if there were no real difference between your control and treatment, seeing a gap this large would be unlikely at the threshold you set, usually 95%. It does not tell you the effect is large or that you should ship it. Always look at the absolute difference and the confidence interval, and decide separately whether the effect is commercially worth acting on.
How should a marketing team handle an unexpected or negative result?
Check your instrumentation first, then report it as it is rather than rerunning until it passes. Write down what it suggests about your mechanism, because a flat result on a well-powered test is often the most useful thing you will learn all quarter. Many teams respond by simplifying the intervention, testing a stronger version of the same principle, or stopping the idea entirely and moving the effort elsewhere.
Conclusion
Start today by choosing one real decision your team is about to make, writing a hypothesis somebody could disprove, and putting the control, one primary metric, guardrails, sample size, and end date on a single page. Once that page exists, the experiment is mostly discipline: run it as designed, and write down what you learn either way.