
To calculate sample size for a consumer survey, set a confidence level and a margin of error, estimate the proportion you expect, and solve n = Z² × p(1 − p) / e². That gives completed interviews. Divide by your expected response rate to get the number of people you have to approach. It takes about 20 minutes once the reporting cuts are written down.
The formula is the easy part. The part that decides whether your study is worth running is what you plan to report separately. Brand trackers and satisfaction surveys almost never die from an under-sized headline figure. They die from cross-tabs with 40 people in them.
I will walk through the whole calculation, including the two adjustments that most guides skip: finite population correction for genuinely small audiences, and design effect for quota-based samples. Updated for October 2026.
Table of Contents
- What You Need Before You Calculate
- Inputs that change the result
- Inputs that do not change the result
- Step-by-Step: From Brief to Contact Target
- 1. Define the population and the decision the survey supports
- 2. Choose the margin of error and confidence level
- 3. Pick the calculation method that matches what you are estimating
- 4. Calculate the completed-survey sample
- 5. Adjust for nonresponse and fieldwork reality
- 6. Check subgroup bases and design requirements
- 7. Document and validate the final number
- Common Sample Size Mistakes
- Frequently Asked Questions
- How do I calculate sample size in a survey?
- Is 20 respondents enough for a survey?
- What is the 10% rule in sampling?
- Why is 30 the minimum sample size?
- Does population size affect sample size?
- Does a margin of error apply to online panels?
- Conclusion
What You Need Before You Calculate
Six inputs go into a defensible number. Five of them move the answer, and one does not.
Inputs that change the result
- Confidence level (Z). 90% gives Z = 1.645, 95% gives 1.96, 99% gives 2.58. Going from 95% to 99% raises the sample by about 38%.
- Margin of error (e). The precision you will accept around a proportion, written as a decimal. Plus or minus 5 percentage points is 0.05. This is the single biggest lever you have.
- Expected proportion (p). The share of respondents likely to give the answer you care about. Default to 0.5 when you have no prior data, because it produces the largest sample.
- Population size (N). Only matters when your audience is small. Above roughly 10,000 people it barely moves the answer.
- Response rate. The share of approached people who finish. Online panels land between 10% and 30% for general adult samples; customer lists to existing accounts often run 20% to 40%.
Inputs that do not change the result
Survey length, question wording and the name of the panel vendor sit outside the calculation. Longer questionnaires depress your response rate, which changes your contact target, but the statistical minimum stays the same. Treat survey length as a fieldwork decision, not a sample size one.
What genuinely moves the result is the reporting plan. If you will publish four regions and three age bands, you are sizing twelve cells, and the cell count sets the total.
Step-by-Step: From Brief to Contact Target
1. Define the population and the decision the survey supports
Write down who the survey represents and what decision changes if the result lands a certain way. “Should we launch this in the Midwest” is a decision. “Understand our customers better” is not, and it will produce an uninterpretable sample size.
Then list the cuts you will report. Total, four regions, three age bands, current customers versus non-customers. That list is what you size against.
2. Choose the margin of error and confidence level
Most consumer work uses 95% confidence. 99% buys you protection against a rarer kind of error and costs sample you will usually want more of in the subgroups instead. The table below shows what 95% confidence buys you at each margin of error, assuming p = 0.5.
| Margin of error | Completed interviews |
|---|---|
| Plus or minus 10 points | 100 |
| Plus or minus 7 points | 200 |
| Plus or minus 5 points | 385 |
| Plus or minus 4 points | 600 |
| Plus or minus 3 points | 1,000 |
| Plus or minus 2.5 points | 1,500 |
| Plus or minus 2 points | 2,400 |
| Plus or minus 1.5 points | 4,000 |
Two things stand out. Tightening from 5 points to 2 points takes six times the interviews. And at 100 completes you are looking at plus or minus 10 points, which is wide enough that a 6-point lead between two options is noise.
3. Pick the calculation method that matches what you are estimating
For a proportion, use n = Z² × p(1 − p) / e². For an average score or a rating scale, the calculation is different and usually needs more interviews. For comparing two groups, you need power and effect size rather than a margin of error. Working out which one you need first prevents a lot of wasted fieldwork.
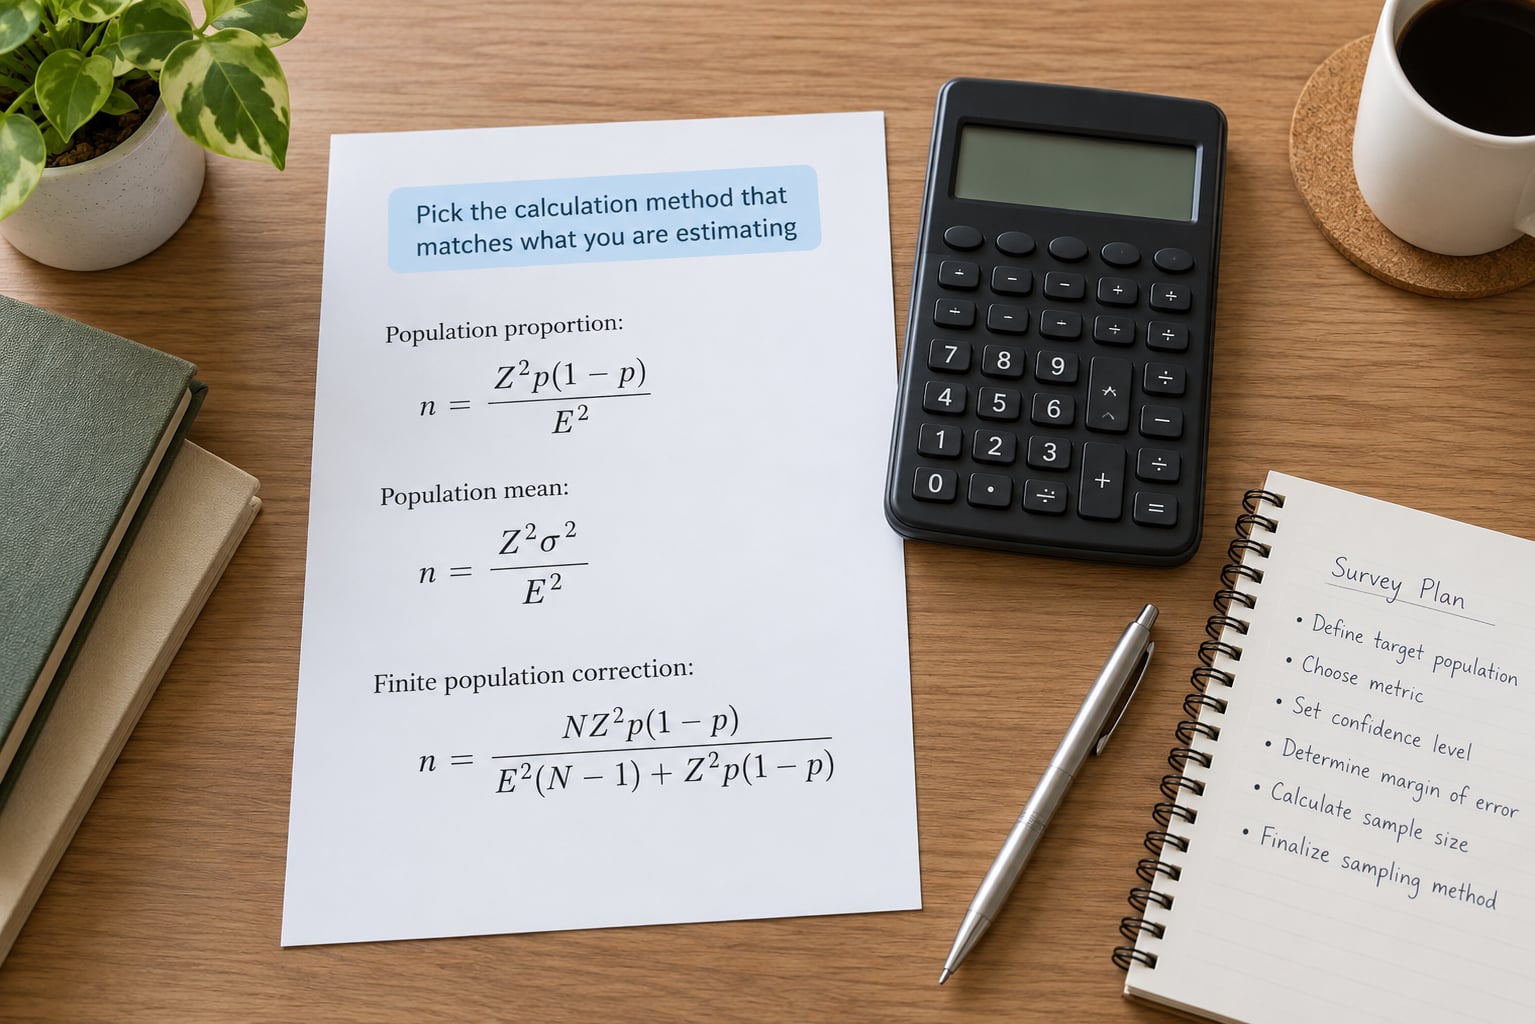
When the population is small, apply the finite population correction. Sampling most of a small audience is wasteful, and Yamane’s formula handles it in one line:
n = N / (1 + N × e²)
| Population size | Sample needed | Sample as share of population |
|---|---|---|
| 500 | 312 | 62% |
| 1,000 | 357 | 36% |
| 5,000 | 381 | 8% |
| 10,000 | 383 | 4% |
| 50,000 | 382 | Under 1% |
| 100,000 and above | 385 | Well under 1% |
This is the answer for B2B researchers with a customer list of a few thousand names. Ask 357 of your 1,000 customers and you are at the same precision as asking 385 of a million. Past about 10,000, the correction is real but not worth the effort, so use the standard formula.
4. Calculate the completed-survey sample
Here is how to calculate sample size for a consumer survey end to end. A packaged food brand wants to test a rebrand with US adults aged 18 and over, and it will report four regions plus a total.
Headline decision: 95% confidence, plus or minus 5 points, p = 0.5, population far above 10,000. The calculation:
n = (1.96 × 1.96 × 0.5 × 0.5) / (0.05 × 0.05)
n = (3.8416 × 0.25) / 0.0025
n = 0.9604 / 0.0025
n = 384
Round up to 385 completes for the total. The arithmetic is short enough to redo on paper, which is worth doing once so you trust the tool you use later.
If you used p = 0.35 because last year’s tracker showed a 35% prompted brand awareness, p(1 − p) becomes 0.2275 and the sample drops to 350. That saving is only safe if the new number will land near 35%. If awareness is the thing most likely to move under a rebrand, stay at 0.5.
5. Adjust for nonresponse and fieldwork reality
Divide the completed-interview target by your expected response rate. At a 30% completion rate, 385 completes needs 1,285 people approached.
Expect this to move. A 15-minute survey on a mobile panel might complete at 12%, while a three-minute survey emailed to your own customer list might reach 35%. Where the rates are uncertain, size on the low end and treat the difference as buffer for the quotas you always end up missing.
Count only finished, usable interviews in your completion rate. Screening out ineligible respondents and speeding through the survey both quietly shrink your real sample.
6. Check subgroup bases and design requirements
The headline calculation gives you precision on the total. Every subgroup is smaller, so every subgroup is wider. A region holding 25% of your 385 completes has a base of about 96, which is plus or minus 10 points.
| Base per cell | Margin of error at 95% | Typical use |
|---|---|---|
| 100 | Plus or minus 10 points | Directional read, large groups only |
| 200 | Plus or minus 7 points | Comparing two cells |
| 400 | Plus or minus 5 points | Reporting a cell as a headline result |
Now check the design. If your fieldwork uses quotas or clustering, apply a design effect. Effective sample size equals completed interviews divided by the design effect, so a deff of 1.2 on 385 completes gives you an effective n of 320. At a deff of 1.5 your effective n is 257, and you are closer to plus or minus 6 points than 5.
Weighting to population targets adds design effect too, usually 1.1 to 1.3 in a national sample. Add it before you finish, not after the weighting has revealed a 1.9.
Two habits catch most of this early. Set a minimum base of 100 and suppress any cell below it, and check that your contact target can physically deliver the quotas you wrote in step one.
7. Document and validate the final number
Write down every assumption you made: Z, e, p, N, response rate, design effect, minimum cell base. Six months later when someone asks why the study was sized this way, that page is the answer.
Then verify the calculation in two independent places. An online sample size calculator and your own spreadsheet should agree, and if they do not, the disagreement is usually a percentage entered as a whole number rather than a decimal.
Use dedicated software for the cases hand arithmetic handles badly. A power calculator or a tool such as G*Power will size a two-group comparison properly, accounting for effect size and dropout. Remember to compare the achieved sample against the recruitment channels you actually have.
Common Sample Size Mistakes
Treating contacts as responses. The most common error by a distance. If your completion rate is 25%, you need four invitations for every completed interview, and quoting the contact number overstates your precision by a factor of four.
Borrowing the 385 rule of thumb and stopping. 385 is the answer to one question: what sample gives plus or minus 5 points at 95% confidence on a large population. It says nothing about your response rate, your design effect, or your cells.
Ignoring the cross-tabs. Sizing the total and only later deciding to compare four regions means two of them will land under 100. Work backwards from the smallest cell you intend to report.
Overstating precision. A margin of error covers sampling variability alone. It does not cover people who were never reachable, respondents who guessed, questions worded ambiguously, or a panel recruited through an ad. Ten times the sample on a biased channel still gives you a tight interval around the wrong number.
Quoting a margin of error for a quota sample. This one causes real trouble in decks. A margin of error assumes every person had an equal chance of selection. Opt-in online panels and social samples do not work that way, so the interval does not exist. If your fieldwork is non-probability, report the achieved sample and the quotas instead of a plus or minus figure.
Sizing after the fieldwork. Calculating the required sample once the data is in tells you nothing you can act on. It is fine to work out what your achieved n supports, but do it before the invoice, not after.
Chasing significance instead of importance. A large enough sample will find a difference between two almost identical options. Before powering a comparison, decide the smallest difference worth acting on, then size for that.
Frequently Asked Questions
How do I calculate sample size in a survey?
Set a confidence level and a margin of error, estimate the proportion you expect, then solve n = Z squared times p(1 minus p) divided by e squared. With 95% confidence, plus or minus 5 points and p of 0.5, that gives 385 completed interviews for a large population. Divide by your expected response rate to get the number of people to approach, and add any subgroup or design-effect requirements.
Is 20 respondents enough for a survey?
For a headline percentage, no. Twenty responses carry a margin of error of roughly plus or minus 22 points at 95% confidence, so a difference you are seeing is usually noise. Twenty is workable for open-ended qualitative work, for checking whether a concept reads clearly, or for a directional read you will act on only if the signal is very strong. Anything you plan to quote needs a base in the hundreds.
What is the 10% rule in sampling?
The 10% rule says never sample more than 10% of a population, so a population of 5,000 caps your sample at 500. It comes from sampling theory rather than convenience, and it is unnecessary for survey work. Your required n is fixed by the margin of error you want. If that number exceeds 10% of the population, apply the finite population correction and sample a larger share knowingly.
Why is 30 the minimum sample size?
Thirty comes from the central limit theorem, which says the distribution of sample means approaches a normal shape as sample size grows. With 30 observations the approximation is usually adequate. For consumer research it is a floor for stable descriptive statistics, not a target for inference. Percentages from 30 people still swing by 18 points or more, and subgroup comparisons are not defensible.
Does population size affect sample size?
Only when the population is small. Above roughly 10,000 people the calculation is identical whether you are surveying a city or a country, because the sample is a negligible share of the total. Below that, apply the finite population correction: sampling 357 of a 1,000-person customer list gives the same precision as sampling 385 of a million. This matters most for B2B and account-based studies.
Does a margin of error apply to online panels?
Not to opt-in panels, social samples or other non-probability recruitment. A margin of error assumes every member of the population had a known, non-zero chance of selection. Self-selected samples break that assumption, so no valid plus or minus figure can be quoted for them. Report the achieved base, the quotas and the recruitment source instead, and reserve margin of error language for probability-based sampling.
Conclusion
Start with the decision, not the formula. Write down what you will report separately, pick the precision you need on the smallest of those cells, and only then run the arithmetic.
Before fieldwork, confirm that the population and objective are written down, that the margin of error and confidence level are chosen deliberately, that subgroup bases clear your minimum, that response rate and design effect are built into the contact target, and that the recruitment channel can deliver the quotas. Five minutes on that checklist saves a study you cannot interpret.