
Only a handful of brand health metrics have a demonstrated link to growth: mental availability, meaningful differentiation, purchase intent and propensity to choose, repeat purchase, retention and share of search. Everything else on a typical tracking dashboard either describes the past or tells you what already happened. Here is the difference, and how to test it.
The trouble starts because brand tracking programmes are usually assembled by asking every team for a question. Sales wants pipeline influence, marketing wants consideration, product wants sentiment, and finance wants a number that moves in the same direction as revenue. A year later you have forty metrics, a dashboard nobody opens, and no way to tell a leading signal from a rear-view mirror.
So the question worth answering first is blunt: what brand health metrics actually predict growth, and which ones only describe it? Get that wrong and every downstream decision inherits the error.
What follows is the framework I use when auditing a tracker. It comes out of the same body of work that Sharp and colleagues at the Ehrenberg-Bass Institute have been refining for decades, plus the commercially oriented modelling Kantar publishes through BrandZ. The aim is not to hand you a list to copy. It is to give you a way to sort your own metrics by what they can genuinely tell you.
One note before we start. If you are new to this, the plainest definition: brand health metrics are the measurable attributes of how a brand is perceived, chosen and valued by its target audience over time, tracked consistently across waves and benchmarked against competitors. Brand health is the current state. Brand equity is what that state has accumulated in value terms. The first is something you can move this quarter. The second takes years, which is exactly why people confuse the two and then lose patience.
Table of Contents
- What Brand Health Metrics Actually Predict Growth
- Brand Health vs Brand Equity: The Distinction That Matters Most
- Which Brand Health Metrics Have the Strongest Link to Growth?
- Awareness, Consideration, Preference, and Loyalty
- Mental Availability and Differentiation Carry the Strongest Evidence
- Commercial Measures That Confirm Brand Strength
- How to Tell a Predictive Metric from a Vanity Metric
- Metrics That Get Tracked and Predict Very Little
- The Metrics to Track by Business Goal
- What to Do When Brand and Sales Metrics Disagree
- How Often Should You Measure Brand Health?
- When to Run a Brand Health Audit Instead of a Tracker
- How to Build a Brand Measurement System That Holds Up
- Frequently Asked Questions
- What are the top 3 business metrics you track for brand-led growth?
- Is Net Promoter Score a leading or lagging indicator?
- What are the 5 key CX metrics?
- What is the best brand health tracker?
- What is the 3 7 27 rule of branding?
- How do you link brand health metrics to business outcomes?
- Conclusion
What Brand Health Metrics Actually Predict Growth
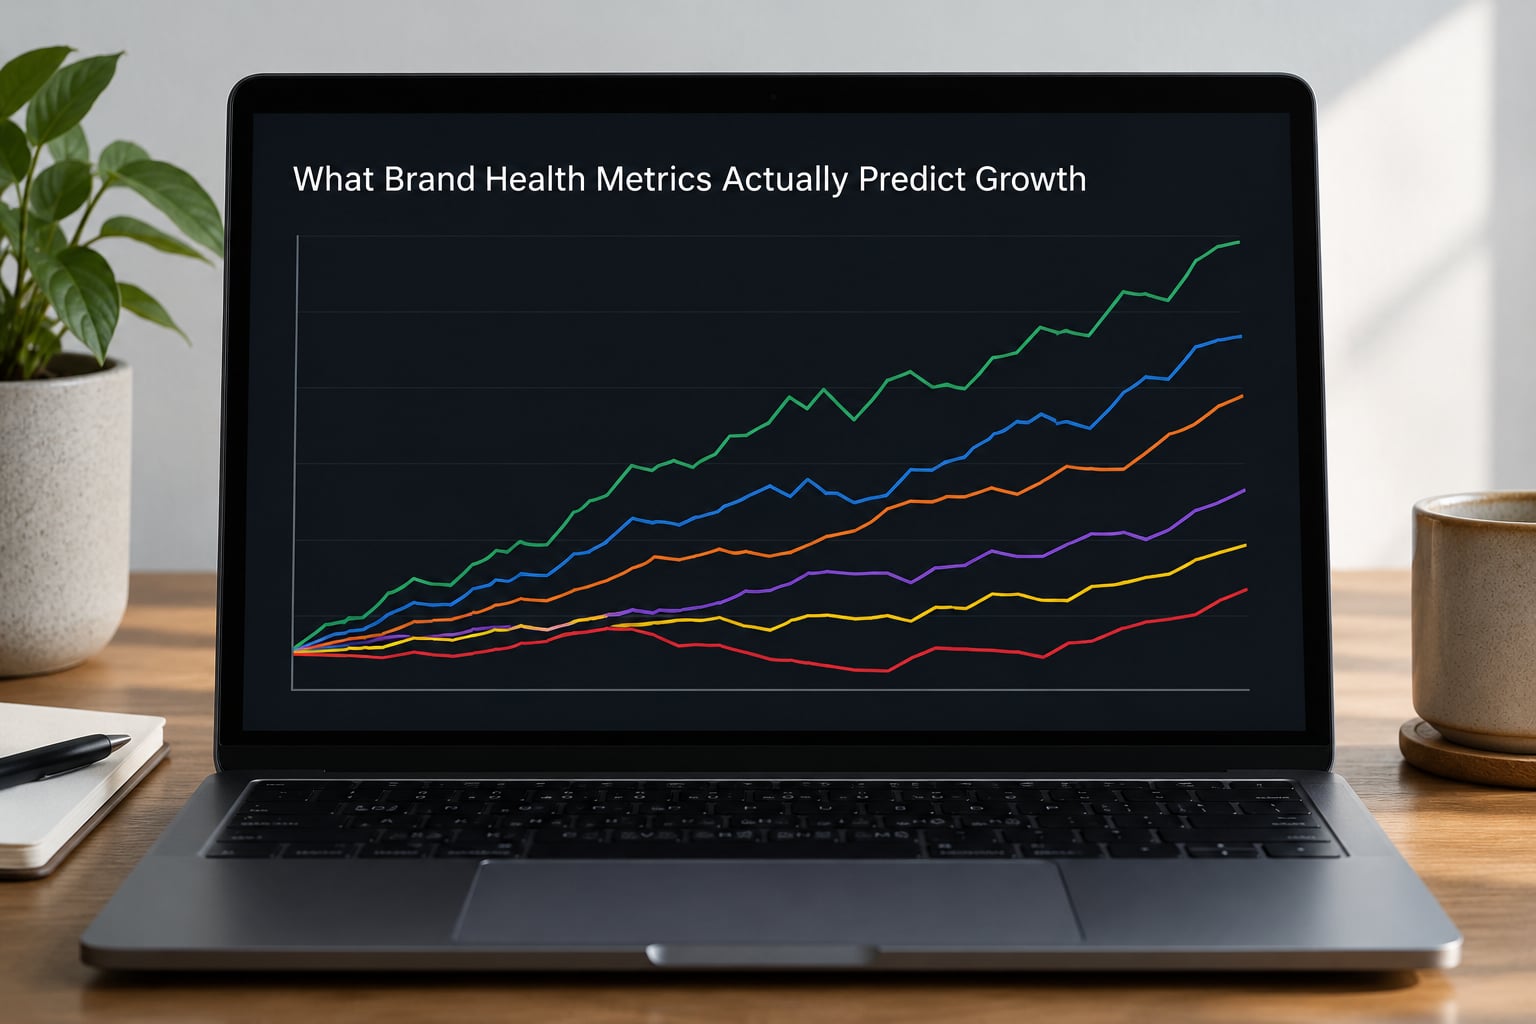
A metric predicts growth when it moves before revenue does, and when movement in it reliably shows up later in sales, share or price realisation. Most metrics people track fail one of those two tests, usually the second one.
Predictive metrics share four characteristics. They lead the commercial outcome by weeks or months. They respond to things a marketing team can actually change. They improve when the underlying business condition improves, so the direction is trustworthy. And they are measured consistently enough that a two-point move means something rather than sampling noise.
Diagnostic metrics are different. They explain why growth happened or why it stalled, and they are genuinely valuable, but they arrive after the fact. Ad recall by channel, sentiment themes in open-ended feedback, unaided versus aided awareness splits: all of these help you diagnose a result you already know about. Mistaking a diagnostic for a predictor is the most common way a tracker fails, because diagnostics feel more insightful than predictors do.
Lagging commercial metrics sit at the other end. Revenue growth, market share, price realisation and retention tell you the truth, and they tell it too late to steer with. A tracker built only on lagging metrics is a reporting function. A tracker that pairs them with genuine leading signals is a management tool, and that is the whole difference between budget you can defend and budget you cannot.
Brand Health vs Brand Equity: The Distinction That Matters Most
| Dimension | Brand health | Brand equity |
|---|---|---|
| What it is | Current state of perception across a defined audience | Accumulated commercial value of the brand asset |
| Typical measures | Awareness, consideration, preference, intent, mental availability, differentiation | Price premium, share of wallet, lifetime value, structural price advantage |
| Speed of movement | Quarters | Years |
| What it is good for | Steering decisions this year | Board justification and valuation |
| Main risk of misuse | Read as equity, then judged too slowly | Tracked quarterly, then blamed for a slow quarter |
The practical mistake here is asking a health metric to prove equity. Awareness can rise twenty points and equity can be flat, because equity depends on pricing power and repeat demand as much as on salience. Track them separately, report them separately, and never put them in the same sentence without saying which one you mean.
Which Brand Health Metrics Have the Strongest Link to Growth?
This is the evidence-graded version. Evidence strength here means how consistently the metric has been shown to co-move with subsequent commercial performance across categories and markets, not how confident a vendor is about it.
| Metric | What it predicts | Leading or lagging | Evidence strength | How to measure it |
|---|---|---|---|---|
| Mental availability | Share of future demand the brand can claim when a need arises | Leading | Strong, replicated across categories | Prompted and unprompted brand recall, penetration, category entry points |
| Meaningful differentiation | Price premium and share of wallet | Leading | Strong | Perceived uniqueness versus competitor set, relevance, brand values |
| Purchase intent and propensity to choose | Near-term volume and share movement | Leading to short-lag | Moderate to strong, category dependent | Future purchase likelihood plus a choice question against named competitors |
| Share of search | Active demand pull, especially before purchase | Leading | Moderate, strongest in low-consideration categories | Branded search volume indexed to category size, corrected for seasonality and paid activity |
| Repeat purchase and retention | Stable baseline volume that funds growth | Lagging to short-lag | Strong but backward-looking | Panel or transaction data, subscription cohorts, category-specific repeat rate |
| Price realisation | Whether brand strength is converting into pricing power | Lagging | Strong as a check, weak as a predictor | Net realised price after promotion versus category average |
| Unaided awareness alone | Very little on its own | Lagging in practice | Weak in isolation | Spontaneous recall with no prompting |
| Net Promoter Score | Retention among existing customers | Lagging | Weak as a growth predictor | Survey response from customer base |
Awareness, Consideration, Preference, and Loyalty
These four sit on the classic brand funnel, and the useful question is which end of it carries future demand. Consideration and preference sit closest to the moment of choice, so they move with purchase behaviour more tightly than anything above them. Loyalty sits below the funnel and describes demand that already exists.
Awareness is the awkward one. Unaided awareness on its own is a weak predictor, which surprises people who have tracked it for twenty years. The Ehrenberg-Bass work reframed it: what matters is not whether people know the brand, but how many buying situations it can enter. That is mental availability, and it is built from reach, distinctive assets, category entry points and familiarity together, not from recall alone.
Mental availability is the share of buying situations in which the brand comes to mind, and separately the share of category buyers who buy it at least occasionally. Category entry points are the situations that trigger the category: for a protein bar, a gym visit or a missed lunch. Brands grow by owning more entry points, not by being universally familiar. If you want one line to defend in a board meeting, that is usually the one that lands.
Why does this predict growth better than raw awareness? Because it is closer to the mechanism. A brand with broad mental availability gets selected more often without additional persuasion, which shows up as penetration and share gain without a matching rise in media pressure. Awareness without penetration is just recognition, and recognition alone does not buy anything.
Mental Availability and Differentiation Carry the Strongest Evidence
If mental availability gets you into the consideration set, meaningful differentiation is what decides whether you are chosen once you are in it. Sharp’s argument is that most brands do not need to beat their competitors, only to be more distinct from them and more relevant to a slightly larger set of circumstances. Winning here is a distribution outcome, not a duel.
Differentiation is the one with a direct pricing story. Kantar’s BrandZ work has repeatedly linked brands that people rate as meaningfully different in their category to measurable price premium and to faster share growth, including in markets where the category itself was growing slowly. That is the link between a brand health metric and revenue that finance understands, which makes it the most defensible metric in most categories.
The distinction between uniqueness and relevance matters more than it sounds. A brand can be unique and irrelevant, which is a wasted asset, or relevant and undifferentiated, which is a commodity competing on price. The metric that predicts growth is the combination: distinct enough to be remembered, relevant enough to be wanted.
Distinctive brand assets are the by-product worth watching. Colour, shape, sound, characters, tone: these are the memory triggers that make mental availability cheaper to build. Ehrenberg-Bass has been consistent that distinctive assets work harder than share of voice spend, because they compound rather than rent.
Commercial Measures That Confirm Brand Strength
Sales growth, market share, price realisation, retention, repeat purchase and share of wallet are the commercial measures. Treat them as lagging indicators: they confirm that brand strength is real, and they are the yardstick against which any brand metric earns its place. When Binet and Field’s work on brand growth puts short-term activation and long-term brand building on a 2×2, the pattern is the same one: the commercial measures are where you read the result, and the perception measures are where you steer.
Share of wallet is the most underused of these. If your retention is fine and your share of market is slipping, the growth question is usually share of wallet: customers are buying you, but less of you. That shows up in panel and transaction data long before it hits an aggregate revenue line, and it changes what you do about it entirely.
Share of voice deserves a caveat. Share of voice that consistently exceeds share of market is a signal of momentum, not a cause. Persistent over-investment in share of voice is usually a symptom of weak mental availability, not a strategy for fixing it.
How to Tell a Predictive Metric from a Vanity Metric

Six questions separate the two. Run any candidate metric through all six before it earns budget, and most vanity metrics fail within two.
One: does it measure behaviour rather than opinion? Behaviour is what people did, opinion is what they said they will do. Purchase intent sits between the two and is weaker than people assume. Real behaviour, search activity and repeat purchase outperform stated preference almost every time.
Two: does it move before the commercial outcome? If a metric only ever moves after sales, it is a report, not a signal. Check the direction and the lag rather than assuming it.
Three: has anyone shown it co-moves with sales? Ask for a lagged correlation with your own data before you accept the claim. Vendor correlations against pooled data are weaker evidence than they look.
Four: do you know the wave-to-wave noise? Every measure has a margin of error. If you do not know the confidence interval on your quarterly waves, you cannot tell a real move from noise, and a dashboard that moves for no reason trains the team to ignore it.
Five: is it actionable by someone? If no specific decision changes when it moves, cut it. Diagnostic value is a real exception, provided you label it diagnostic.
Six: does it have a comparison group? Every number means nothing without a benchmark: category norm, competitor set or your own history. An absolute percentage of awareness tells you almost nothing; awareness rising eight points while the category rises twelve is a loss.
Metrics That Get Tracked and Predict Very Little
Awareness on its own, as covered above, belongs here. Net Promoter Score measures advocacy among people who already bought you, so it is a retention signal dressed as a growth signal. Social engagement and follower counts sit far from purchase in most categories, and influencer-driven engagement can be bought in ways that distort the number. Advertising recall measures execution, not brand strength. Press mentions and share of sentiment count activity, not persuasion. And dashboard vanity metrics of the general variety, any metric with no named owner and no decision attached, tend to outlive their usefulness because nobody has to defend them.
The pattern in this list is worth naming. These metrics are easy to collect, cheap to report and flattering in a deck. None of them is useless, and all of them are misleading when presented as growth drivers.
The 3 7 27 rule of branding, popularised from Ehrenberg-Bass work, is a useful corrective. It proposes that brands grow by 3 brands being chosen more often, 7 brands being bought occasionally, and 27 brands appearing in the wider market. The 3 is the mental availability portion, and it is the piece most directly tied to growth. The 27 and the 7 matter for reach, but they are not where the growth math sits, which is why chasing broad reach on its own underperforms.
The Metrics to Track by Business Goal
The right metric set changes with the objective. This is the objective-branching framework that separates useful trackers from generic ones.
| Business goal | Lead with these metrics | Confirm with these | Trap to avoid |
|---|---|---|---|
| Share growth and acquisition | Mental availability, category entry points, share of search, propensity to choose | Penetration, market share, sales growth | Chasing awareness with no purchase consequence |
| Defence and retention | Repeat purchase rate, satisfaction among users, differentiation versus a specific competitor | Churn, retention, share of wallet | Reading NPS as a growth metric |
| Premium pricing | Meaningful differentiation, perceived quality, relevance | Price realisation, price premium versus category | Leading on price premium when differentiation is thin |
| Repositioning | Meaningful differentiation, relevance among target segments, mental availability in the new frame | Penetration in new segment, blended awareness movement | Judging success on aggregate awareness, which moves too slowly to guide you |
| New market or segment entry | Awareness, familiarity and entry points as a baseline, then consideration | First-purchase rate, repeat rate, cost per first order | Benchmarking a launch against mature-market norms |
Two cautions. For repositioning, aggregate awareness almost never moves within the timeline, so judge it on segment-level differentiation and penetration instead. For new-market entry, the first twelve months are about building a baseline, not beating a norm, and the useful comparisons are internal over time rather than external against established players.
What to Do When Brand and Sales Metrics Disagree
Sooner or later you get the awkward conversation. Brand consideration fell four points, sales grew six percent. Someone in the room will decide one of those numbers is wrong, and the argument that follows usually kills the tracker.
Both numbers can be correct, because they measure different things over different windows. Consideration is a rate among people who could buy. Sales is a count of what actually got bought, driven by distribution, price, promotion and competitor disruption as much as by perception. A quarter can have strong sales and weak consideration simply because the category is heavily promoted right now.
The move is to stop asking which is right and start asking which changed for a reason. Split consideration by segment. If the decline is concentrated in one segment that is also shrinking, you have a mix effect rather than a brand problem. If it is spread evenly and sales grew anyway, look at price and promotion before you blame the brand. And check mental availability at the same time, because falling consideration alongside stable mental availability usually means something in the purchase environment changed, not the brand.
What you should never do is quietly drop the inconvenient metric from the next deck. That is how a tracker loses credibility, and credibility is the only reason anyone funds it. Report the disagreement, name the mechanism you think explains it, and state what evidence would settle it.
The same reasoning applies when a brand metric and a competitor metric move apart. A rising share of voice against a flat category is not necessarily progress, and the segment-level cuts are usually where the real story is. Aggregate numbers hide the segment that is driving the movement and the two that are quietly deteriorating.
How Often Should You Measure Brand Health?
Cadence depends on how fast your category moves and how big your sample needs to be to detect a real change, not on how often the dashboard refreshes.
| Cadence tier | What it covers | Typical fit | Question it answers |
|---|---|---|---|
| Continuous | Behavioural proxies: branded search, site traffic, share of search, social listening | Fast-moving consumer categories, ecommerce | What is demand doing right now? |
| Quarterly | Attitudinal tracker: awareness, consideration, preference, intent, differentiation | Most consumer brands with a meaningful budget | Are the leading signals moving? |
| Annual | Deep dive, brand strength, equity read, segmentation refresh | Large brands, slow categories such as automotive or appliances | Is the brand accumulating value? |
| Campaign-based | Pre and post evaluation around a specific launch | Any brand running bursts of activity | Did that burst change anything? |
Category velocity decides the middle tiers. Beverage, apparel and beauty move fast enough that quarterly tracking is too coarse in a good quarter. Automotive, appliances and most B2B categories move slowly enough that annual is honest and quarterly is noise being mistaken for signal.
On significance, the practical rule is that you cannot detect a small change with a small sample, and this is where trackers fail quietly. Ask your research supplier for the confidence interval on each measure, then ask what change in that measure you could actually detect at your sample size. If the answer is larger than the change you care about, you have a design problem, not a tracking problem. Fixing it means fewer measures, bigger samples, or a longer wave.
A tracker also needs a qualitative layer, because numbers tell you that consideration fell and never tell you why. A handful of open-ended responses or short interviews each wave, coded for themes, catches things a fixed questionnaire cannot: a competitor campaign that landed, a pricing change customers reacted to, a service failure spreading on social. Keep it small and run it alongside the quantitative core rather than as a separate project.
Word the questionnaire carefully, because sequence shapes answers. Asking about competitors before your own brand depresses your brand scores, and asking purchase intent immediately after a satisfaction question inflates it. Fix the order once, keep it fixed, and treat any reordering as a new study rather than a continuation.
When to Run a Brand Health Audit Instead of a Tracker
Not everything needs a standing programme. A tracker pays for itself when you have a recurring decision to make, usually quarterly investment allocation. If your decision is one-off, a tracker is overkill and an audit is the cheaper, faster answer.
Run an audit when you are entering a new category or geography and need a baseline you will not have for years. Run one after a rebrand or a significant repositioning, because you need to know where perception now sits against where it used to sit. Run one before a major investment decision, such as entering a market or taking on a competitor, where a broad read matters more than a trend.
The difference in practice is depth versus continuity. An audit typically asks more, covers more segments and includes qualitative work, then stops. A tracker asks less, covers the same core every wave, and keeps going so you can see direction. If someone asks why you are measuring again and the honest answer is to check the same thing, you probably want a tracker instead.
How to Build a Brand Measurement System That Holds Up
Six steps, in order. This is closer to a discipline than a template, and the order matters more than the specifics.
Start with the growth question, not the metrics. Write one sentence: what would have to be true for this brand to grow next year, and by how much. Not a metric. A business condition. Everything downstream is chosen to answer that sentence.
Separate the three layers. Headline KPIs, brand driver metrics, diagnostic metrics. Keep them in separate parts of the report. The moment a diagnostic metric shares a slide with a KPI, the reader stops knowing which is which. This is the single most useful structural change most trackers need.
Pick one leading signal and one commercial outcome per goal. Not one per team. If the goal is share growth, the leading signal is mental availability or propensity to choose, and the outcome is penetration or market share. Two numbers you will watch together, every wave.
Test predictive validity on your own data. Plot your brand metric against sales with a lag. Use at least twelve months of waves if you have them, and test whether the metric leads the outcome rather than merely moves with it. Also check the reverse: how well does the commercial outcome predict the brand metric? If the answer is equally well, you have a coincident measure, and you should treat it as such. This test is unglamorous and it is the only way to know which of your metrics deserve the title.
Set the decision rule in advance. Decide now what happens if the leading signal drops two points for two consecutive waves. A tracker without a pre-agreed decision rule produces reports, not decisions, and the report will be debated rather than acted on.
Freeze the questionnaire and govern it. Change wording once and you break comparability with every prior wave, so log every change and never change without a documented reason. Assign an owner to the glossary. Keep rotating modules for the questions you only need once a year, and put the rest on a fixed core that never changes. The best-designed first wave is the one designed to be the second wave.
For B2B and SaaS specifically, the framing shifts. Cycles are long, so purchase intent measured in a quarterly survey says little about a deal that closes in nine months. Weight consideration and differentiation more heavily, treat share of search and direct traffic as your fastest behavioural read, and lean on win rate and share of wallet in named accounts as the confirming measure. Marketing and sales should agree the framework before launch, not reconstruct it afterwards, which is the consensus in practitioner forums and the reason it matters.
Frequently Asked Questions
What are the top 3 business metrics you track for brand-led growth?
For brand-led growth, most teams need three: a leading brand signal such as mental availability or purchase intent, a confirming commercial measure such as market share or retention, and a financial measure such as revenue growth or customer lifetime value. The first tells you where things are heading, the second confirms it happened, and the third is what the board funds. If you only have room for three numbers, these are the three.
Is Net Promoter Score a leading or lagging indicator?
NPS is a lagging indicator. It comes from customers who have already bought, so it mostly reflects experiences that happened. It is a reasonable measure of advocacy and a decent input to retention modelling, which is why it belongs in a commercial review. It is a weak signal of future growth because it cannot tell you whether non-buyers will start buying, which is the question a leading metric has to answer.
What are the 5 key CX metrics?
The five most common customer experience metrics are customer satisfaction score, Net Promoter Score, customer effort score, first contact resolution and churn. All five are operational or retrospective, which is the key contrast with brand health metrics. CX metrics tell you how the experience you already delivered landed. Brand health metrics, particularly mental availability and consideration, tell you what may happen before the purchase.
What is the best brand health tracker?
The best tracker is the one whose metrics have a proven link to your commercial objective, not the one with the longest feature list. Judge any tracker on sampling consistency, whether question wording is frozen across waves, the size of the change it can detect, and how clearly leading and lagging measures are separated in its reporting. A tool that gives you forty metrics and no decision rules is worse than a simple quarterly tracker with three.
What is the 3 7 27 rule of branding?
It is a model of how buyers distribute across brands in a category, usually expressed as 3 brands chosen often, 7 bought occasionally and 27 in the wider market. The strategic implication is that growth comes from being bought more often by more people rather than from being the only brand anyone buys. The 3 in the model is the mental availability component, and it is the part most directly tied to growth.
How do you link brand health metrics to business outcomes?
Plot each brand metric against sales with a lag, rather than assuming the link. Look for whether the metric moves first, whether the relationship holds across waves, and whether it survives at segment level. Then pair each leading signal with one commercial outcome and pre-agree what you will do if the signal moves against you. Regularity beats sophistication here, and a metric with a documented, if imperfect, relationship is worth more than an impressive correlation you cannot repeat.
Conclusion
The first thing to do is smaller than most tracker redesigns: pick one growth goal for next year and pair it with one leading brand signal and one commercial outcome. Then watch the pair together for four waves and see whether the brand signal moves first. That test will tell you more about which of your brand health metrics are worth funding than any framework on a slide.
Everything else follows. Once one relationship is proven on your own data, you have a template: add the next goal, add its signal, grade the evidence, and cut whatever cannot be shown to lead anything. A tracker with eight honest metrics beats one with forty, every time.