

To use the duplication of purchase law, calculate each brand’s penetration in your category, work out the customer overlap that market share predicts, and compare it with the overlap you actually observe in buyer-level data. Where the gap is small, the brands behave like most other brands in that category, and that tells you where to spend attention. The whole method takes an afternoon with a clean dataset.
It is not, despite the name, a law in the legal sense, and it does not describe loyal customers who stay with one brand. It describes something duller and more useful: brands in the same category tend to share buyers in rough proportion to their size. Once you can calculate that proportionality for your own market, you have a benchmark that tells you when a brand pair is unusually close, unusually distant, or exactly as expected.
This guide walks through the whole process, including a worked example with fictional coffee brands. The numbers are invented, the arithmetic is not, and you can reproduce every line of it in a spreadsheet.
Table of Contents
- What the Duplication of Purchase Law says
- What You Need
- Step-by-Step
- Step 1: Define the behaviour before applying the law
- Step 2: Assemble buyer-level data and screen the brand pairs
- Step 3: Calculate penetration, share of buyers and expected duplication
- Step 4: Measure actual overlap and calculate the coefficient D
- Step 5: Read the three possible results
- Step 6: Turn the result into a decision, then monitor it
- Common Mistakes
- Tips for using purchase-pattern insights responsibly
- Frequently Asked Questions
- What is the duplication of purchase law?
- How do you calculate duplication of purchase?
- Is duplication of purchase the same as double jeopardy?
- Why do my customers buy my competitors’ products?
- What does over-duplication and under-duplication mean?
- Does the duplication of purchase law apply to B2B and services?
- Conclusion
What the Duplication of Purchase Law says
The Duplication of Purchase Law states that a brand shares its customers with other brands in the same category roughly in proportion to those brands’ market shares. A small brand’s buyers buy the category leader far more often than they buy a rival of similar size, and the leader shares almost none of its buyers with any single small brand. Goodhardt, Ehrenberg and Chatfield proposed this in 1984.
What You Need
Buyer-level data is the one requirement you cannot substitute. Everything else has a workaround; that does not.
| What you need | Minimum viable version | Why it matters |
|---|---|---|
| Buyer-level purchase records | 12 months of who bought what, with a stable household or person identifier | Overlap is measured between people, not between brands. Without the person identifier there is no duplication analysis, only co-occurrence. |
| A defined category | One shelf, one aisle decision | Proportionality holds within a choice set. Widen it and buyers stop competing for the same slot. |
| Penetration per brand | Buyers of the brand divided by all category buyers | This is the single most useful number in the whole method. |
| Volume share per brand | Units-equivalent volume or value divided by category total | Lets you separate a small brand with many buyers from a big brand with few. |
| A benchmark | The category average overlap across all your brand pairs | Proportionality is a relative claim. You need the category to define normal. |
| A decision to feed | A market entry, an extension, a portfolio review, a budget split | An analysis with no decision attached becomes an interesting chart nobody reopens. |
If you do not have panel data, you can run the first half of the method. Ask a sample of recent buyers which brands in the category they bought in the last year and calculate penetration from those answers. You cannot reliably measure overlap that way, so treat the expected-duplication column as your finding and skip the actual-overlap column until real transaction data exists.
One caution on terminology. Searches for this phrase pull up legal duplication-of-remedies clauses, gene duplication and counterfeit “dupe” products. None of that is here. If you find yourself reading about remedies or counterfeits, you have left marketing.
Step-by-Step
Step 1: Define the behaviour before applying the law
Say precisely what you are claiming. “Brands share buyers in proportion to market share” is a claim about repertoires: most category buyers hold two to four brands and buy from them on rotation. Repeat purchasing, single-brand loyalty and cross-category basket building are three different things, and mixing them produces numbers that look decisive and are not.
The term is a descriptive regularity drawn from repeated category studies, not a law in the sense that gravity is one. It holds well in packaged consumer goods where brands sit side by side on one shelf and buyers choose from the same handful. It holds less well where buying is infrequent, where contracts lock a buyer to one supplier, or where the choice set changes constantly. State your category and your purchase cycle before you trust the output.
This step also stops the most damaging misreading. Because overlap tracks size, “my competitor is stealing my customers” is a category error: a small brand shares buyers with every larger brand in roughly the same proportion, so there is no single rival doing the stealing. If you are looking for a rival to blame, the method will not provide one.
| Law | What it states | Unit of analysis | Typical use |
|---|---|---|---|
| Duplication of Purchase | Brands share buyers in proportion to their market shares | A pair of brands, measured across buyers | Market entry screening, extension cannibalisation checks, portfolio reviews |
| Double Jeopardy | Small brands have fewer buyers, and those buyers buy slightly less often | A brand against the category size curve | Setting growth expectations and budget allocation |
| Duplication of Viewing | Audiences of two broadcasts overlap in proportion to their sizes | A pair of programmes, measured across audiences | Scheduling and reach planning in broadcast media |
Double Jeopardy explains why small brands stay small. Duplication of Purchase explains who is in the buyer pool of a brand. Confusing the two is the most common searcher error on this topic, so it is worth memorising that the first is about frequency over time and the second is about overlap between brands.
Step 2: Assemble buyer-level data and screen the brand pairs
Build one row per buyer per brand per period, then pivot to a simple buyer-by-brand yes or no grid. From there the rest is arithmetic, and you can do it in a spreadsheet or a pivot table without any specialist tooling.
Screen before you calculate. Drop brand pairs where either brand has fewer than about 50 buyers in the period; the overlap estimate gets noisy fast at low counts and a misleading coefficient is worse than no coefficient. Drop pairs that never appear on the same shelf or in the same decision. Keep pairs where both brands sit above roughly 3% penetration, since a brand with a 1% share will always look like it over-shares with everyone simply because it has so few buyers.
Decide the window now and hold it steady. A 12-month window captures an annual repertoire well. A 4-week window measures shopping frequency, not brand choice, and will make every brand look loyal to itself.
Step 3: Calculate penetration, share of buyers and expected duplication
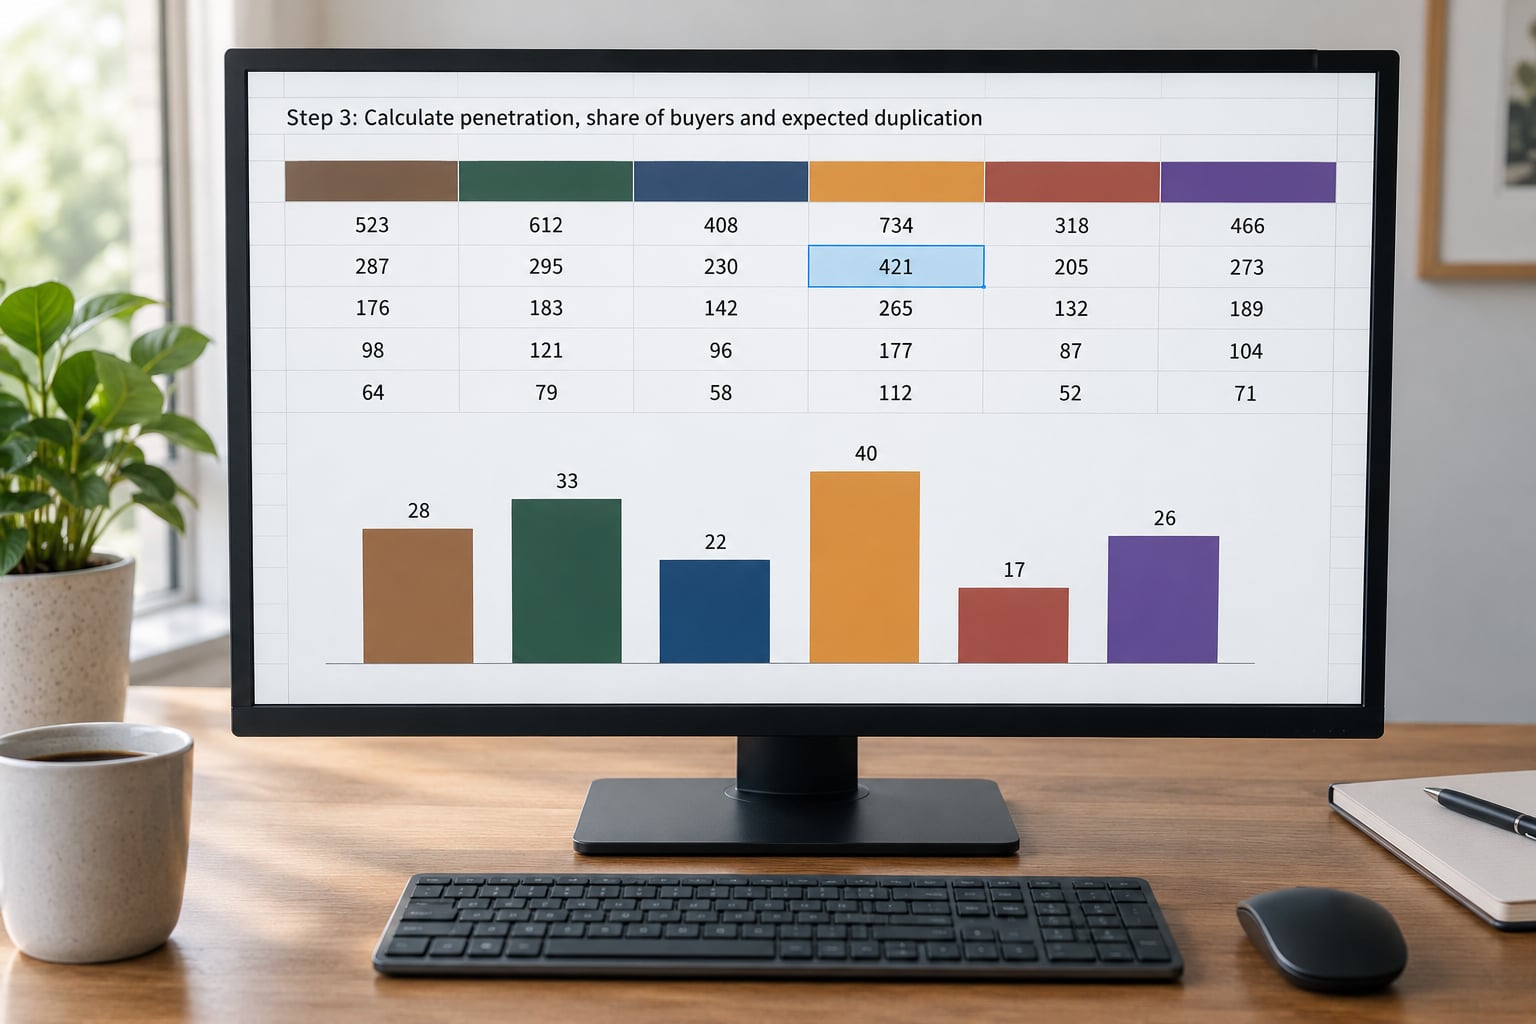
Penetration answers a question market share cannot: how many people bought this brand at all. The classic illustration uses two fictional smartphones. A brand with 30% penetration and four purchases per buyer earns 12 points of share per 100 category buyers; a brand with 14% penetration and eight purchases per buyer earns the same 12. Identical share, completely different strategies, and only one of them is building a customer base.
Worked example. Imagine a ground coffee category with 1,000 households buying in the year, and five brands:
| Brand | Penetration (buyers) | Share of buyers | Market share (volume) | Purchases per buyer |
|---|---|---|---|---|
| Alto | 40% | 40% | 38% | 4.6 |
| Basra | 25% | 25% | 22% | 4.0 |
| Corvo | 15% | 15% | 13% | 4.2 |
| Delfi | 10% | 10% | 9% | 4.4 |
| Elsa | 6% | 6% | 6% | 4.9 |
Penetrations sum to 96%, which tells you something useful before any overlap is measured: almost every buyer in this category buys more than one brand. That is repertoire buying, and it is the normal state of affairs rather than a problem.
Expected duplication for a pair is the product of the two penetrations. If buyers picked brands independently, the chance that an Alto buyer also bought Basra would be 40% of 25%, so 100 of the 1,000 buyers. Work out expected overlap for every pair you kept on the shortlist.
Published work sometimes expresses the benchmark differently, as a duplication coefficient comparing a brand pair’s overlap with the average overlap across the category. With a five-brand category the category average is built from the same handful of pairs you are already looking at, which makes it harder to audit. The expected-versus-actual ratio below is the same idea with fewer moving parts, and it is easier to defend in a planning meeting.
Step 4: Measure actual overlap and calculate the coefficient D
Count, for each pair, how many buyers bought both. Divide by 1,000 to get the actual overlap rate, then divide that by the expected overlap. That ratio is the pair’s duplication coefficient D: 1.00 means the brands share customers exactly as their sizes predict, above 1.00 means more than expected, below means less.
| Brand pair | Expected overlap | Actual overlap | Actual buyers | D | Reading |
|---|---|---|---|---|---|
| Alto and Basra | 10.0% | 9.6% | 96 | 0.96 | On benchmark |
| Alto and Corvo | 6.0% | 6.1% | 61 | 1.02 | On benchmark |
| Alto and Delfi | 4.0% | 4.2% | 42 | 1.05 | On benchmark |
| Basra and Corvo | 3.75% | 5.4% | 54 | 1.44 | Over-duplication |
| Basra and Delfi | 2.5% | 2.4% | 24 | 0.96 | On benchmark |
| Corvo and Delfi | 1.5% | 1.4% | 14 | 0.93 | On benchmark |
Five of the six pairs sit within a few points of their expected overlap. That is the law doing its job: nothing about these brands is unusual, and the overlap between them is explained entirely by how big each one is.
Basra and Corvo are the exception. Expected 38 buyers, observed 54, D of 1.44. Something is linking these two that has nothing to do with their relative size, and the next step is finding out what.
Step 5: Read the three possible results
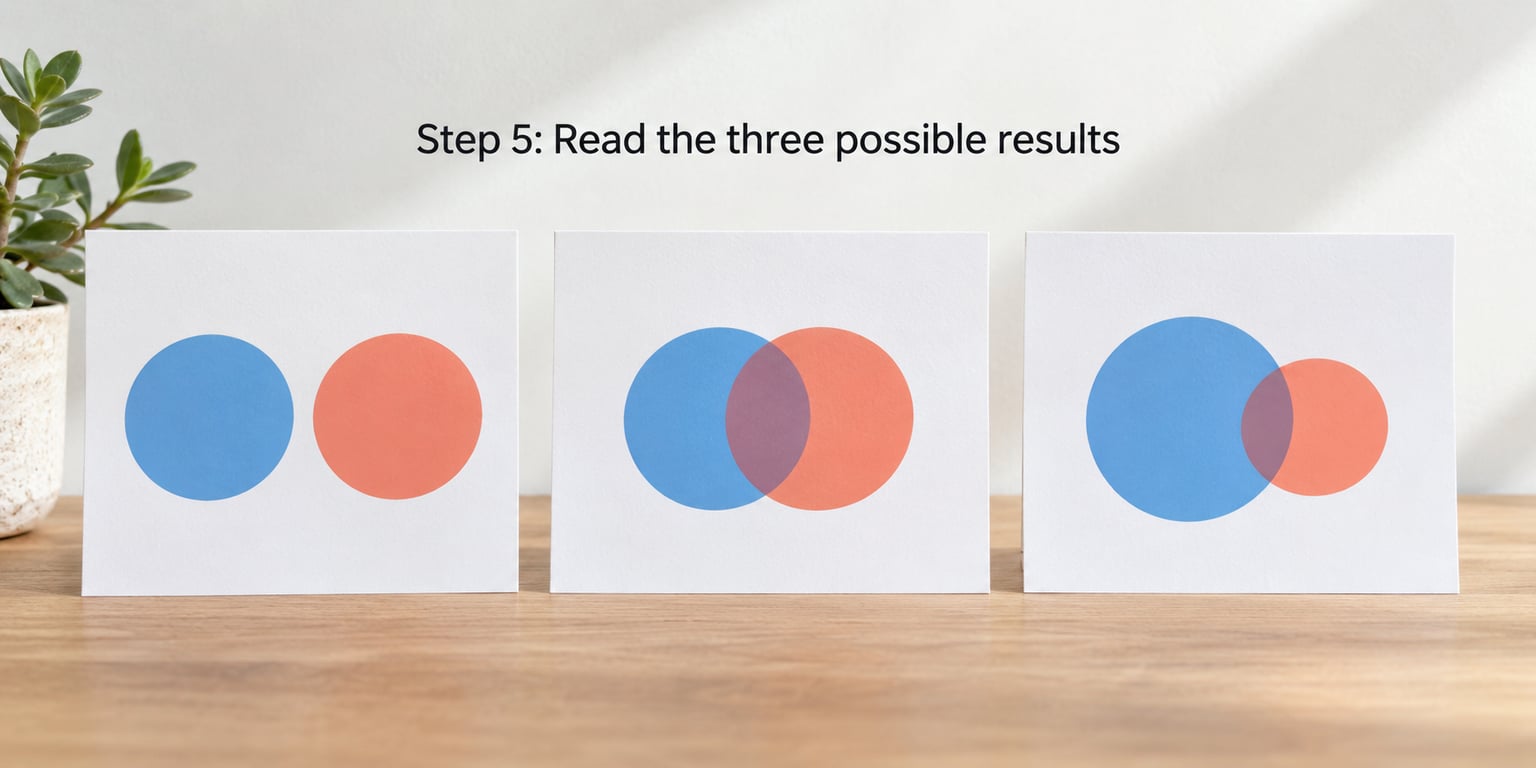
Three readings cover nearly every pair you will calculate.
On benchmark (D roughly 0.90 to 1.10). The overlap is explained by size. This is the finding most people get and do not use: it means the category is behaving normally and the brands are not, in buyer terms, rivals in any special sense. Do not spend budget defending against overlap that would happen anyway.
Over-duplication (D above roughly 1.20). The same buyers buy both brands far more often than chance predicts. In the coffee example, Basra and Corvo might sit next to each other on shelf, share a review audience, be bought together for a specific recipe, or be owned by the same parent with a loyalty scheme that links them. Over-duplication is a prompt to investigate a real mechanism, not a sign that one brand is winning.
Under-duplication (D below roughly 0.80). The two brands reach almost entirely separate buyers. That is common in geographic expansion, in different price tiers sold through different retailers, or when two brands serve genuinely different jobs. It is worth checking whether the two brands are even competing for the same decision; sometimes under-duplication means they should not be measured against each other at all.
Set your thresholds before you look at the results, and write down that you did. A band of 0.90 to 1.10 is a reasonable starting convention, and reporting a coefficient as a single number invites arguments that a band avoids.
Step 6: Turn the result into a decision, then monitor it
Over-duplication on a proposed extension is your cannibalisation signal. If a new variant shares 44% more buyers with an existing variant than its size predicts, the extension is mostly a reshuffle of customers you already have, and the incremental volume you forecast will be optimistic. The same calculation run on a competitor’s brand pair tells you where a rival already has a captured overlap you cannot buy your way into.
Under-duplication on adjacent brands is a portfolio argument for keeping both. Two variants that reach disjoint buyers earn their own shelf space. Two variants with an overlap of 1.4 probably argue for fewer, better-differentiated products.
Under-duplication with the whole category is a warning on the brand, not on the category. A brand that shares buyers with nobody at much below benchmark is being bought for a narrow, specific reason, and broadening it means widening distribution and distinctiveness rather than sharpening the offer.
Then keep monitoring. Re-run the analysis every six or twelve months and watch three things: whether D for an over-duplicated pair falls as the novelty wears off, whether penetration is rising for the brand you acted on, and whether returns or complaints moved. A duplication result is a snapshot of structure, not a permanent fact, and one off-pair reading can be noise.
Common Mistakes
These are the errors I see most often, in roughly the order they cause damage.
Treating it as a guaranteed law. It is a strong empirical regularity with documented exceptions, not physics. The fix: state your category and purchase cycle, and report a coefficient with a band and a sample size attached.
Confusing it with Double Jeopardy. Double Jeopardy is about how small brands buy less often. Duplication of Purchase is about which buyers two brands share. Mixing them leads to arguments about loyalty that the data never addressed.
Reading overlap as customer theft. A leader and a tiny rival will always share very few buyers, and a mid-sized brand will always share buyers with nearly everyone. There is no special rival. The fix: drop the language of theft entirely and report D against the benchmark.
Using share of buyers as if it were market share. A brand with 4% penetration and very high frequency can out-sell a brand with 10% penetration. Penetration feeds the duplication calculation and volume share feeds your revenue model; they are not interchangeable.
Calculating D for tiny brands. Below about 50 buyers in the period, the overlap count is mostly noise dressed up as a finding. Filter first, calculate second.
Comparing pairs across categories. Benchmark duplication is category-specific. A D of 1.3 in haircare says something different from a D of 1.3 in pet food, because the underlying repertoires and purchase cycles differ.
Judging the work by short-term revenue alone. The changes this analysis informs, brand extensions and geographic launches especially, take several buying cycles to show up. Pair the commercial result with penetration and distribution measures, or you will conclude the method failed when it has only been slow.
| Symptom | Likely data problem | Fix |
|---|---|---|
| Every pair returns D around 1.00, including pairs nobody shares | Duplicate rows per transaction inflating both penetrations and overlap | Deduplicate to one row per buyer per brand per period before pivoting |
| D values swing wildly between runs | Window shorter than the purchase cycle | Extend the window to cover at least one full category purchase cycle |
| Penetrations sum to well over 100% | Category boundary too wide, or an error in the share-of-buyers denominator | Narrow to one decision occasion and recheck the denominator |
| One brand pair shows D of 3 or more | Only a handful of buyers bought both, usually a loyalty cohort | Check the raw counts; if fewer than about 20 buyers overlap, report it as a cohort, not a coefficient |
| Overlap for every pair is implausibly low | Identity lost at the point of sale, so buyers cannot be matched across purchases | Check how the household or person identifier is created before trusting anything downstream |
Tips for using purchase-pattern insights responsibly
Report D as a range with a count, not a single clean decimal. “D between 1.35 and 1.50, based on 54 overlapping buyers” survives a challenge. “D is 1.44” does not.
Show the benchmark beside the number. A coefficient means nothing until the reader sees what normal looks like in your category this period, and a category average that has shifted is itself a signal worth discussing.
Say what you cannot see. Panels under-report infrequent and low-value purchases, online-only buying ages out of the data, and buyers who left the category are often missing entirely. A method that quietly assumes perfect measurement will be used to make decisions it cannot support.
Keep the decision proportionate to the evidence. One over-duplicated pair justifies a question to the brand team about mechanism. It does not justify withdrawing a product line, reallocating a national budget, or claiming in a board deck that one brand has captured another’s customers.
Re-run it on a schedule and keep the history. Brands drift, shoppers switch, and a result that held for two years can stop holding quietly. A time series of D for the same pairs is far more informative than a single snapshot you present once.
Say plainly what the method is not good for. Duplication of Purchase does not measure brand equity, pricing power, or which customer is more profitable. It describes who buys what alongside whom, which is a narrower and much more reliable claim than most competitive analyses make.
Frequently Asked Questions
What is the duplication of purchase law?
It states that brands in the same category share buyers roughly in proportion to their market shares. A small brand’s customers buy the category leader far more often than they buy a rival of similar size, and the leader shares almost none of its buyers with any single small brand. Goodhardt, Ehrenberg and Chatfield proposed it in 1984.
How do you calculate duplication of purchase?
Calculate each brand’s penetration, then multiply the two penetrations for a pair to get the expected overlap. Count the buyers who bought both brands and divide by the total category buyers for the actual overlap. The ratio of actual to expected is the pair’s duplication coefficient D. 1.00 means the overlap is exactly as size predicts.
Is duplication of purchase the same as double jeopardy?
No. Double Jeopardy describes how small brands have fewer buyers and those buyers purchase slightly less often. Duplication of Purchase describes how buyers are shared between any two brands. The first explains why small brands stay small over time; the second tells you which customers a brand reaches alongside its rivals.
Why do my customers buy my competitors’ products?
Because most category buyers hold a repertoire of several brands and buy from them on rotation. Holding that repertoire is normal, and it happens more with bigger brands because they have greater mental and physical availability. Over-duplication above a benchmark, not the mere fact of overlap, is what deserves investigation.
What does over-duplication and under-duplication mean?
Over-duplication means two brands share noticeably more buyers than their sizes predict, which usually points to a real link such as shelf adjacency, shared audiences or a loyalty scheme. Under-duplication means they reach almost separate buyers, which often reflects different price tiers, different regions or different jobs to be done rather than a weakness.
Does the duplication of purchase law apply to B2B and services?
It can, with more caution. The proportionality pattern is usually weaker where purchases are infrequent, negotiated, locked by contract or spread across a long sales cycle, because there is no quick repeated choice between brands. Region and channel often split buyers more than brand size does, so segment the analysis before trusting a single category-wide coefficient.
Conclusion
Pick one brand pair you already argue about, calculate penetration for both, multiply them, and compare that expected overlap with the buyers you can actually count. One afternoon of work tells you whether there is a pattern worth chasing or whether you have been defending against something the category would have produced anyway.


