
A trend is a gradual, sustained shift in behaviour that keeps gaining ground and eventually becomes normal. A fad is a short, intense burst of attention, driven by novelty or hype, that peaks fast and collapses once the attention moves on. If you want a 40-second version: look at what happens after the spike, not during it.
That last sentence is the whole argument, and it is the thing most of the writing on this topic skips. Forum threads on this question all ask it the same way, and nearly every answer is a definition swap: a trend lasts longer, a fad is short-lived. Definitions do not help you at the moment of decision, because at that moment you cannot see the future.
So how to tell a trend from a fad is a prediction problem, not a labelling exercise. Seven tests follow, and each one gives you something to examine, the reading that supports a trend, the reading that supports a fad, and a line to write down. A worked example runs alongside, because the tests are far easier to apply once you have watched them applied.
| Signal | Trend | Fad |
|---|---|---|
| Lifespan | Years to decades, often still rising years later | Months, occasionally a single season |
| Adoption curve | Slow S-curve: incubation, early adopters, mainstream | Near-vertical spike then a steep fall |
| Driver of the rise | A structural change: new technology, demographic shift, unmet need | Novelty effect, a creator, a media cycle |
| Scope | Spreads across unrelated industries | Confined to one category or community |
| Media behaviour | Coverage fades, behaviour stays | Coverage fades and behaviour fades with it |
| If you commit capital | Demand still there when the novelty wears off | Inventory, shelf space and ad spend stranded |
One vocabulary note before the tests, because readers mix these up constantly and the mix-up distorts the analysis. A trend is a sustained behavioural shift. A style is a repeated aesthetic convention that may or may not catch on at all. A vibe is an aesthetic mood that is largely performative and rarely changes how anyone behaves. A classic is a trend that finished: the thing that used to be a trend and is now just how things are done.
| Term | What it is | Typical lifespan | Test to apply |
|---|---|---|---|
| Trend | Sustained behavioural shift with a structural driver | Years | Does behaviour hold after attention moves on? |
| Style | Recurring look or convention, adoption optional | Long, irregular | Does anyone behave differently because of it? |
| Vibe | Performed mood, mostly cosmetic | Months | Did any budget, habit or purchase change? |
| Fad | Attention burst with a novelty driver | Weeks to months | What share of adopters come back at month three? |
| Classic | A completed trend absorbed into normal practice | Indefinite | Do newcomers assume it was always there? |
Table of Contents
- What You Need
- Step-by-Step: How to Tell a Trend from a Fad
- Step 1: Define the behaviour in one measurable sentence
- Step 2: Establish the baseline before the spike
- Step 3: Measure repeat adoption, the check that settles how to tell a trend from a fad
- Step 4: Watch the retention curve after the novelty spike
- Step 5: Test whether it holds across segments and industries
- Step 6: Ask what drove the rise, and what people give up to join it
- Step 7: Set a review window and a decision rule before you commit
- Where you are on the trend life cycle
- Common Mistakes
- Frequently Asked Questions
- How long does it take to tell a trend from a fad?
- Is a spike in social media engagement enough to show a trend?
- How can a brand test whether a trend is worth pursuing?
- What is the difference between a fad and a seasonal behavior?
- Should every new cultural trend be treated as a business opportunity?
- Conclusion
What You Need
None of this needs a data team. It needs a baseline, and a baseline is just what the number looked like before anybody started paying attention to it. Most bad trend calls are really bad baseline calls.
A written definition of the behaviour. Not “short-form video is trending” but “the share of our under-30 audience who post at least three times a week.” If you cannot write it as a measurable sentence, you cannot track it, and you will end up arguing about vibes.
At least three data sources that disagree with each other. Search interest, sales or transaction data, and one behavioural measure such as repeat purchase or retention. Sources that all move together tell you one thing; sources that diverge tell you where you actually are in the cycle.
Twelve months of history. Some of the best trend work is simply subtracting a seasonal pattern that was already there before anybody claimed credit for the change. Twelve months is usually enough to spot seasonality; two years is better if the data is cheap to pull.
Audience feedback in their own words. Comments, review text, support tickets, sales call notes, community posts. This is the closest thing you get to the underlying need, and it is the only source that tells you why rather than how much.
One competitor’s behaviour as a control. If a competitor has also changed their stock, hiring or product line, the change may be structural. If only you changed, check your own incentives before you call it a trend.
Step-by-Step: How to Tell a Trend from a Fad
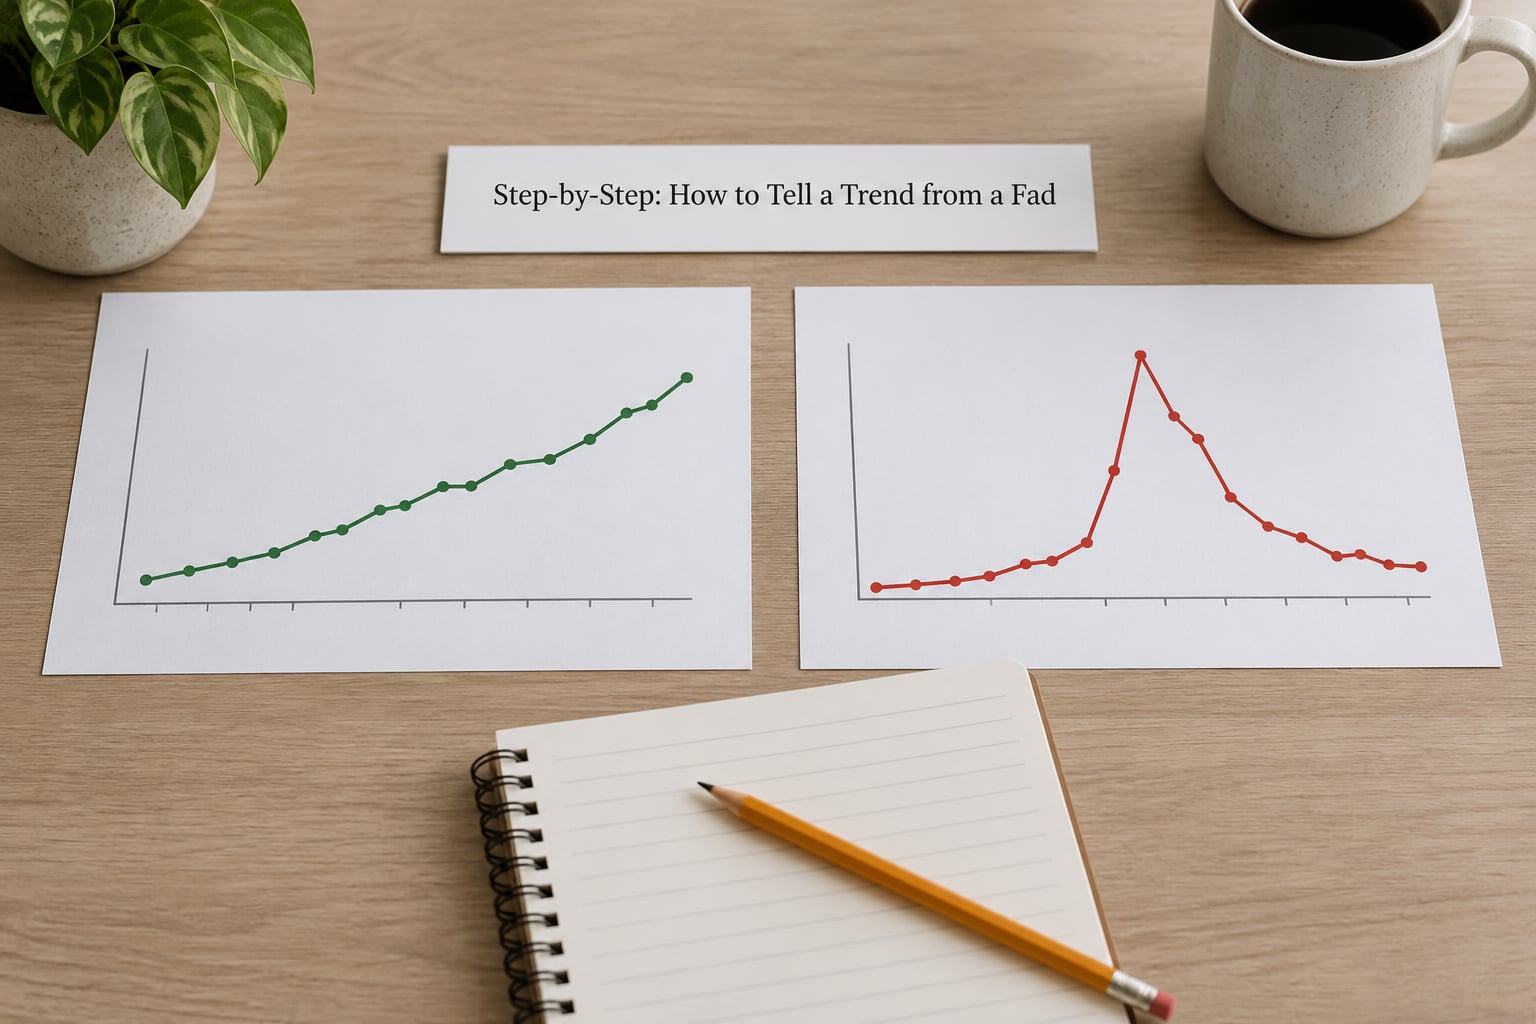
Run the seven tests in order. Each one is cheap, and each one eliminates a specific way of being wrong. Steps 3 and 4 do most of the work; the others stop you from fooling yourself before you get there.
Step 1: Define the behaviour in one measurable sentence
Write the claim as a number with a denominator and a time window. “Our category grew 40 percent” tells you nothing; “new customers who bought the device in their first 30 days used it again within 90 days, at 3 times the rate of the previous cohort” tells you almost everything.
Trend reading: you can write the sentence, and the number moves in a way that would surprise you if you had to defend it in a meeting.
Fad reading: the only thing you can measure is attention: mentions, searches, impressions, footfall. Attention is a real signal, but it is upstream of behaviour and it is the easiest number in the business to inflate.
Document: the definition sentence, in the same words, in every later update so you are not quietly redefining the subject halfway through.
Step 2: Establish the baseline before the spike
Pull the history and plot it. A trend usually has a visible incubation: a long flat stretch, then a slow bend upward that most people ignore. A fad usually goes from near-zero to peak with nothing in between.
Trend reading: an S-curve with an adoption rate you could explain. The rise is slow enough to have been missed by people who were not looking, which is the signature of a genuine diffusion rather than a media event.
Fad reading: a near-vertical line. Steepness is not strength here, it is the absence of a foundation. Nothing was built during the quiet period, so there is nothing to stand on when attention moves.
Document: the baseline value and the date it starts. Without that date, any later claim that growth is sustained is unfalsifiable.
Step 3: Measure repeat adoption, the check that settles how to tell a trend from a fad
This is the test that decides most cases, and almost nobody runs it. Ask what a real user does at month three. Do they buy again, renew, keep using it, or recommend it without being asked? Repeat behaviour is expensive to fake and impossible to fake at scale, which is exactly why it separates the two categories so cleanly.
Trend reading: retention holds or improves after the novelty period. Early adopters told people about it; the ordinary cohort is now doing it quietly, and repeat usage climbs.
Fad reading: retention collapses the moment the crowd moves. Repeat purchase sits far below what the first purchase surge implied, and the second cohort never arrives. One widely cited case pair from the food and apps world launched in the same year around 2009: the ride-hailing app went on to compound, and the plant-based meat product’s trajectory went the other way. Same year, same hype cycle, opposite outcome.
Document: the cohort retention figure at month three, with the cohort definition. Retention percentages without a stated cohort window are marketing.
Step 4: Watch the retention curve after the novelty spike
The single most decisive number is search interest twelve months after the peak, expressed as a share of peak rather than an absolute figure. A fad typically returns to somewhere between zero and a fifth of its peak. A trend settles into a plateau at a meaningful fraction of it, and keeps a long tail.
Trend reading: a floor, not a return to zero. Demand normalises into a steady base that ordinary people now treat as unremarkable, which is what success looks like from the inside.
Fad reading: the curve falls off a cliff and stays there. Abandonment is the most recognisable signal available, which is why people can list forgotten fads so easily in hindsight and never saw them coming.
Document: peak value, twelve-month value, and the ratio. Revisit it at month eighteen; that is where a plateau either becomes a trend or quietly reveals itself as a fad.
Step 5: Test whether it holds across segments and industries
Split the data by customer type, region, price band and category. Then check whether the idea has turned up in places that have nothing to do with each other: a food trend showing up in interiors and travel, a software habit showing up in how people organise their kitchens.
Trend reading: the pattern holds in several segments and leaks into adjacent industries. A genuine cultural shift gets picked up and translated by people who never heard the original.
Fad reading: it lives inside one community and dies at its edge. Most fads never leave the group that produced them; they are intensely real inside the group and invisible two groups over.
Document: which segments moved and which did not. A trend that is only strong in your best segment is a campaign.
Step 6: Ask what drove the rise, and what people give up to join it
Two questions, and they are linked. First: what caused this? New capability, a demographic shift, a cost or regulatory change, or a creator and a media cycle. Second: what does adopting it cost the person doing it, in money, time, hassle or comfort?
Trend reading: the driver is structural and the adoption requires little sacrifice. Households adopted mobile banking because it removed friction, not because it was exciting.
Fad reading: the driver is attention and adoption demands a real trade-off: more cost, more effort, more social risk. Fads cluster in identity and status categories, where being seen matters more than being useful.
Document: one sentence each for cause and cost. If you cannot name the trade-off the adopter accepts, ask what they get that they did not have before.
Step 7: Set a review window and a decision rule before you commit
Decide what you will do at month six while you are still calm, and write it down. This is the step that separates an analyst from an enthusiast, and it is the one most often skipped.
Trend reading: strong on retention, floor in the decay curve, and structural driver. A larger commitment is defensible.
Fad reading: strong on attention, weak on retention, novelty driver. Keep the commitment small and reversible.
Document: the trigger conditions in advance, such as retention holding above a set level and search interest staying above a set share of peak. Also record what it cost to be wrong and how quickly you could undo it. That reversibility figure is often more valuable than the forecast, because it decides how big a bet the uncertainty allows.
Where you are on the trend life cycle
The seven tests tell you trend or fad. They do not tell you where in the curve you currently stand, and that changes what the right response is. A five-stage model borrowed from food-industry trend work generalises cleanly to any category: embryonic, early adoption, entering the mainstream, breaking the mainstream, and tapering off.
In the embryonic stage almost nobody is involved and the data is noisy enough to be useless. Early adoption is where a genuine trend is visible to anyone watching closely, and where a fad looks identical, because both are small and both have enthusiastic early users. Entering the mainstream is the window that rewards preparation and punishes hesitation. Breaking the mainstream is the point of no return for most fads, and the point at which many trends become boring and permanent. Tapering off is where you discover whether you had a trend or a fad all along, and the only reliable way to know which is to have kept measuring.
Two things make this harder than it used to be, and both are worth naming. Recommendation systems compress attention into shorter bursts, so the peak comes faster and the decline starts sooner. A behaviour that a magazine would have seeded for three years can now peak inside a fortnight and be gone before most of the industry has agreed on a name for it. The practical consequence is that the quiet incubation period keeps getting shorter, which means waiting for undeniable evidence increasingly costs you the entire window. That is the argument for small reversible bets early rather than confident commitment later.
Common Mistakes
Treating social volume as demand. Mentions measure attention, and attention is cheap. Fix: never let attention be the only category of evidence, and hold it to the test in Step 3.
Reading a spike as growth. The first surge is identical in both categories. Fix: require a second data point after the peak before you write the word trend anywhere.
Ignoring segment differences. A movement can be strong in one group and flat everywhere else. Fix: report the weakest meaningful segment alongside the strongest.
Using anecdotes instead of baselines. Anecdotes are directionally useful and numerically useless. Fix: keep them, label them as anecdotes, and never let one carry a decision on its own.
Calling it permanent before the repeat cycle shows. You cannot know yet, and the temptation to be first is powerful. Fix: state confidence as a percentage with a date attached, and revise it on a schedule.
Ignoring your own incentives. People declare trends they want to be true, and teams adopt fads because a competitor launched them. Fix: check whether anyone in the room benefits from the conclusion before accepting it.
One more worth naming, because it is the most common retrospective error: calling something a fad after it ended and a trend before it worked. Sort every past call into a labelled list and count them. That audit is the fastest way to find out whether your bias runs toward over-caution or over-eagerness, and both fail in expensive directions.
On decision tips: when retention is solid and the decay curve has a floor, commit in stages and expand. When the signal is mostly attention, take a cheap option instead: a small run, a limited pilot, a reversible experiment, a month of content. And when the evidence is genuinely mixed, the correct move is usually to keep watching with a date attached rather than to force a call. Waiting with a scheduled review is a decision; waiting indefinitely is not.
Frequently Asked Questions
How long does it take to tell a trend from a fad?
For most consumer behaviours, four to six months is enough to get a provisional answer, because that is roughly one repeat cycle for many purchases and two full seasonality curves for lighter ones. Be honest about the limit: at four months you are separating a plateau from a decline, not proving staying power. Month twelve is the first genuinely decisive checkpoint, and month eighteen confirms it.
Is a spike in social media engagement enough to show a trend?
No. A spike is the most common feature shared by both trends and fads, so it barely discriminates between them at all. It becomes useful only as one input among several, checked against behaviour: repeat usage, cross-segment spread, and what search interest looks like two quarters after the peak. Attention tells you something is happening. Only behaviour tells you whether it is sticking.
How can a brand test whether a trend is worth pursuing?
Run a small reversible test before a full commitment: one limited production run, a single market, or a short content series capped at a fixed budget. Measure repeat behaviour and the search-interest floor, not reach. Set the go or no-go conditions and the date before the test starts, so the result is a fact rather than an argument. The point of the pilot is to buy evidence cheaply.
What is the difference between a fad and a seasonal behavior?
A seasonal behaviour is predictable and repeats on roughly the same annual schedule, driven by weather, holidays or an annual event, so you can plan for it year ahead. A fad is unpredictable and dies without warning, driven by novelty and attention rather than a calendar. The practical test: if the same pattern returned last year and the year before, it is seasonal, and it belongs in your baseline.
Should every new cultural trend be treated as a business opportunity?
No, and treating them that way is how brands end up with dead inventory and wasted spend. A trend deserves a business response only when it passes the behavioural tests: sustained repeat adoption, a decay curve with a floor, and a structural driver. The rest deserve awareness at most. Not every cultural shift has a monetisable form, and chasing all of them guarantees you fund the wrong several.
Conclusion
Attention is not evidence of staying power. Sustained behaviour across time, across audience segments and across unrelated industries is what separates a trend from a fad, and the retention curve after the novelty spike is the fastest way to see it.
If you take one thing from this guide to how to tell a trend from a fad, make it the definition sentence: pull twelve months of history, write the behaviour as one measurable claim, then check what happens at month twelve.