To run a trend analysis for a brand team, you frame the decision the trend needs to inform, collect evidence from at least three independent sources, test whether the shift is durable or a fad, score it, and hand the surviving trends to creative as briefs with named owners. Budget roughly one working day a month for a single category, less if you already keep a signal log.
Most brand teams that get this wrong are not short of data. They are short of a decision. A listening tool fires 200 alerts a week, nobody owns the log, and by the time someone presents a “top trends” deck the campaign it was meant to shape has already been briefed.
The fix is a process, not a platform. Here is the one I would hand a brand manager on day one, in seven stages, with the artifacts each stage has to produce.
Table of Contents
- What You Need Before You Start
- A decision the analysis has to inform
- A scope with edges
- An owner and a small contributor group
- A minimum tool stack
- How to Run a Trend Analysis for a Brand Team, Step by Step
- 1. Frame the Decision and Set the Trend Scope
- 2. Build a Baseline of What You Already Know
- 3. Collect Evidence From Independent Sources
- 4. Separate Trends, Fads, and Seasonal Movement
- 5. Score Momentum, Meaning, and Opportunity
- 6. Translate the Analysis Into Brand Decisions
- 7. Present, Test, and Govern the Follow-Through
- Common Mistakes That Kill a Trend Analysis
- Tips for Making the Analysis Useful
- Frequently Asked Questions
- How often should a brand team run a trend analysis?
- What data sources are most useful for brand trend analysis?
- How can we tell if a trend is likely to last?
- Should a trend analysis be done by marketing or research?
- How do we measure whether a trend-driven brand response worked?
- What is the difference between a trend, a fad, and a seasonal effect?
- Conclusion: Start With One Decision and One Log
What You Need Before You Start
You need four things settled before any research begins, and none of them is software.
A decision the analysis has to inform
Pick one decision: a campaign theme for next quarter, a positioning review, a product development brief, a messaging architecture refresh. A trend analysis without a decision attached becomes a reading list. With one attached, every signal you collect has somewhere to land.
A scope with edges
Write down the category, the audience, the geography and the time horizon on one line. “Beauty trends” is unusable. “What UK consumers aged 25 to 40 are saying and searching about skin barrier repair between 6 and 18 months out” is a scope you can actually work.
An owner and a small contributor group
One person accountable, three to five people contributing. In practice the owner is a brand manager or strategist; contributors come from social, media planning, product, and whoever sits closest to sales data.
A minimum tool stack
Use what covers these five jobs. Anything more is usually tool fatigue, and tool fatigue is the single most common complaint I hear from brand teams running several disconnected listening platforms at once.
| Job to be done | Typical tool | What it is actually good at | What it will not tell you |
|---|---|---|---|
| Search demand direction | Google Trends, plus a paid keyword tool such as Semrush or Ahrefs | Whether interest is rising, falling or flat, and roughly how fast | Volume in units, or whether anyone buys |
| What people are saying | Social listening platform, or a saved-query setup in the tools you already license | Language, framing, sentiment tone, emerging vocabulary | Representative proportions of the market |
| Behaviour you own | CRM, transactional data, site search logs, review exports | What your existing customers actually did | What non-customers are about to do |
| Qualitative depth | Your own interviews, social care transcripts, community groups, survey waves | Motivation, trade-offs, the reason behind the behaviour | Size or speed of the shift |
| Ambient scanning | Newsletters, trade press, agency reports, cultural feeds | Weak signals before they show up in search or sales | Anything quantitative at all |
Free tiers are genuinely workable for a single category. A practitioner on r/branding described treating one social sentiment tool as a quick pulse check rather than a full trend system, which is the right use of it. What matters is that you can say, for every number in your read-out, which tool produced it and over what date range.
How to Run a Trend Analysis for a Brand Team, Step by Step
Seven stages, and each one hands a specific artifact to the next. Skip a stage and the next one is guesswork with extra steps.
1. Frame the Decision and Set the Trend Scope
Turn a vague request to look into trends into one question a team can answer yes or no. Write it as: “Should we [specific brand action] in [category] for [audience] in [geography] over [horizon]?”
A useful example: “Is there enough genuine consumer pull for a refill-first positioning in US grocery, aimed at households with kids under five, to justify a repositioning test next fiscal year?” That is answerable. “What are the trends in grocery right now?” is not, and it will produce a deck nobody acts on.
Then set the evidence rule before you collect anything. Most teams get value from a simple standard: a candidate trend needs to appear in at least two independent sources, one of which is behavioural rather than social. Write that rule down at the top of the log so nobody renegotiates it once a favourite trend appears.
2. Build a Baseline of What You Already Know
A baseline is the boring artifact that saves you from a false alarm. Without it, any movement looks like news, because you have no idea what normal looks like for your category.
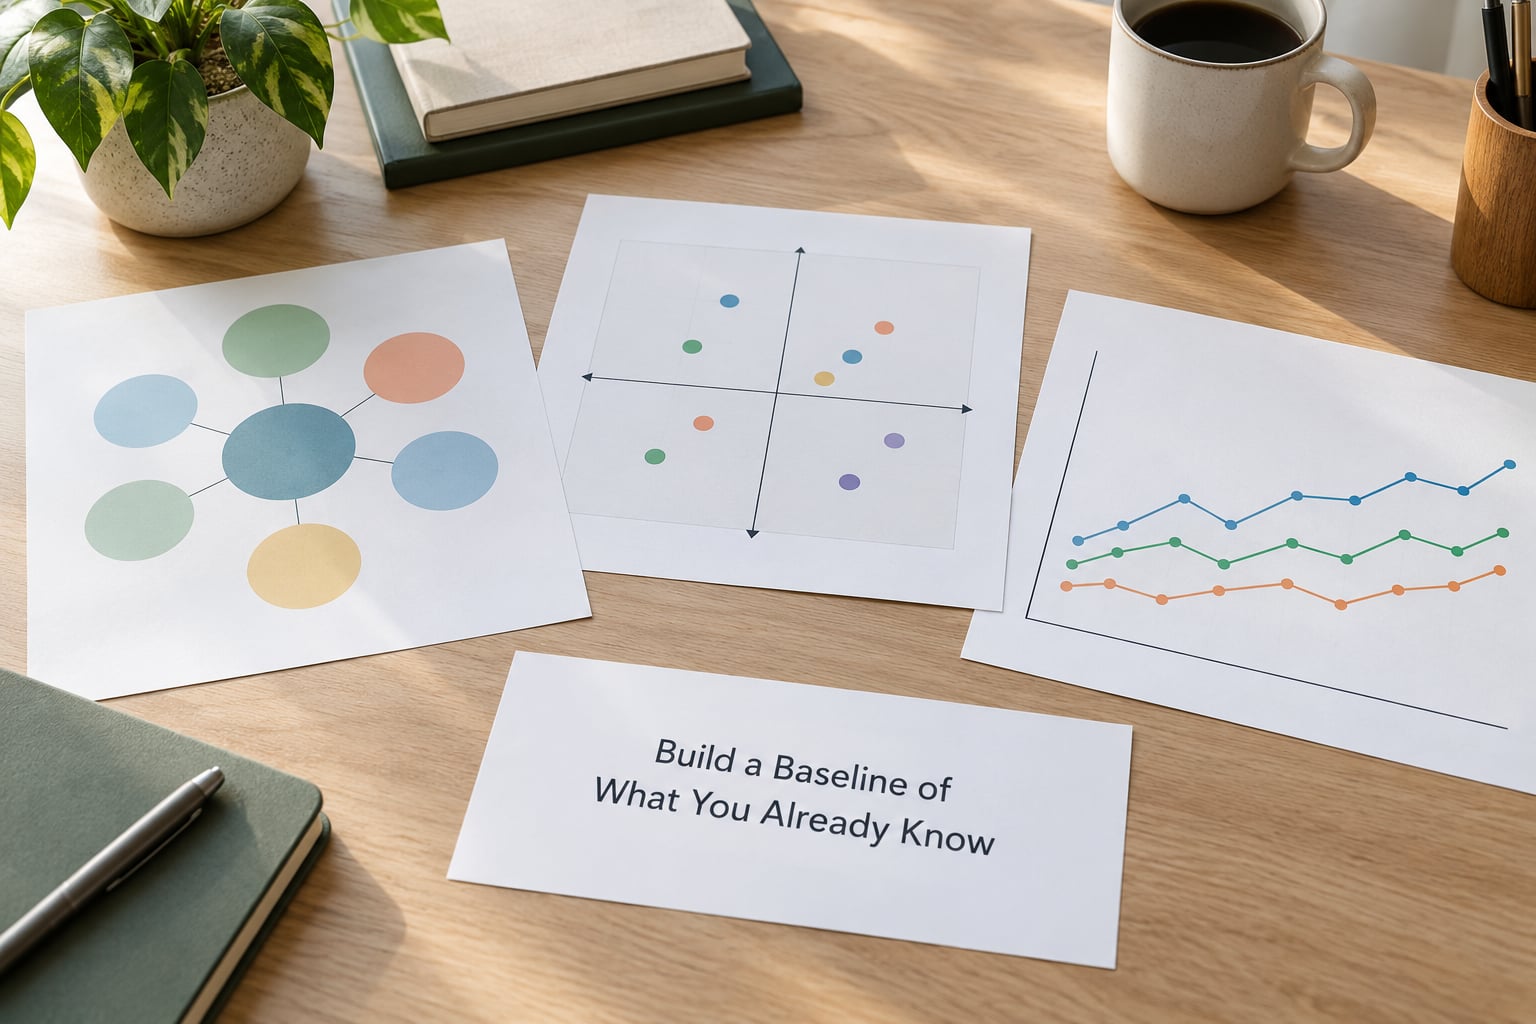
Four baseline artifacts are enough for most categories:
- A category map showing where the brand sits, where competitors sit, and which territory is uncontested.
- Current audience behaviour, ideally from a wave-over-wave tracking survey if you run one. Two waves is enough to spot drift; twelve is better.
- A twelve-month baseline chart of your category’s demand, so seasonal swings and genuine shifts can be told apart.
- An assumptions list: the things the team believes about the category that nobody has actually tested.
I have watched a team nearly rebrand around a “shift” that turned out to be a category that spikes every autumn. Twelve months of data in one chart would have caught it in ten minutes.
Keep the baseline somewhere the whole team can see it, and date it. Assumptions without a timestamp quietly become facts.
3. Collect Evidence From Independent Sources
This is where the work actually happens, and where the discipline matters more than the tool. Six source families cover almost everything.
Search behaviour. Direction and shape of interest over time, compared against a stable control term so you can see whether the whole category moved or just one term. Look at the shape of the curve, not just the peak. A spike and a step are different animals.
Conversation. What people are saying in forums, comments, review sections and creator posts. The most useful output here is usually vocabulary, not sentiment totals. New phrases appearing repeatedly in unrelated conversations tell you something is shifting underneath the language.
Behaviour you own. Repeat purchase rates, basket composition, search terms on your own site, product returns, support tickets. This is the least glamorous source and the hardest for competitors to fake.
Review and complaint text. Unprompted complaints are a rich seam. They show you a job consumers are trying to do that the category has not solved.
Competitor and category moves. New products, repositioning language, price architecture, hiring patterns, retail placement. Competitors are often slow to react, and their moves tell you what they think your customers will care about next.
Ambient cultural and regulatory scanning. News, cultural moments, policy shifts, demographic changes. These rarely show up in search data first, which makes them your early warning.
Three rules keep this honest. Triangulate: a signal only counts when it shows up in two or more independent sources, and independence means different underlying data, not two tools scraping the same social posts. Date everything: a number without a date range is not evidence. And log the weak and duplicate stuff too, marked as weak or duplicate, because a thread that keeps reappearing for nine months is exactly the pattern that turns into a trend.
4. Separate Trends, Fads, and Seasonal Movement
A trend analysis is mostly subtraction. Most candidates turn out to be one of four things, and only the first deserves budget.
| Type | How long it typically lasts | The tell | What to do |
|---|---|---|---|
| Durable trend | Three years or more | Appears across sources, different groups, and stays through a news cycle | Build into positioning and annual planning |
| Cyclical | Runs in a repeatable multi-year pattern | Peaks and troughs line up with past cycles and external drivers | Plan capacity and timing around the cycle |
| Seasonal | Repeats predictably each year | Same window last year shows the same shape | Treat as calendar planning, not news |
| Fad or microtrend | Weeks to a few months | Concentrated in one platform or one age group, dies without a product push | Monitor, do not commit budget |
Four practical tests. Persistence: has it survived at least one news cycle without a paid push behind it? Breadth: is it showing up in groups that do not talk to each other? Function: does it solve something, or is it only a look? Cost of being late: what do you lose by waiting two quarters, and what do you lose by moving now? That last question usually settles more arguments than the other three.
Watch the counter-trend too. Whenever a signal shows up hard, something usually pushes back, and the pushback is often where the interesting positioning sits. A rise in one behaviour frequently arrives with a rise in its opposite, and brands that pick a side early look prescient rather than reactive.
5. Score Momentum, Meaning, and Opportunity
Score every candidate trend that survived step 4, out of five on each of six criteria. The score does not decide anything on its own; it forces the team to argue about the same dimensions instead of the same gut feeling.
| Criterion | The question | 0 looks like | 5 looks like |
|---|---|---|---|
| Momentum | How fast and how broadly is it moving? | Flat or falling, one source only | Rising steeply across multiple independent sources |
| Meaning | Does it reflect a real change in values or identity? | Surface-level aesthetics | Connects to a stated belief or identity shift |
| Audience relevance | Does our priority audience care, and is it theirs? | Adjacent audience, borrowed interest | Core audience, self-expressed |
| Strategic fit | Does it extend what the brand is good at? | Off-territory, needs new capabilities | Uses existing strengths and opens new ground |
| Commercial potential | Is there a plausible path to revenue? | No product or service implication | Clear product, pricing or channel implication |
| Ease of activation | Can we do something about it this year? | Needs capabilities we do not have | A small team can start in one quarter |
Set your thresholds before you score anything, because scores drift upward once a stakeholder has a favourite. A workable default: 24 or above out of 30 means pursue, 16 to 23 means monitor with a named reviewer and a review date, and 15 or below means discard and log the reason.
Use the total as a sorting device, then break ties on two things. Reversibility: if the response is cheap to undo, act earlier. And evidence quality: two strong sources beat five weak ones, whatever the total says.
Record the score next to the evidence, dated. A trend that scored 18 in March and 27 in August tells you something a snapshot cannot.
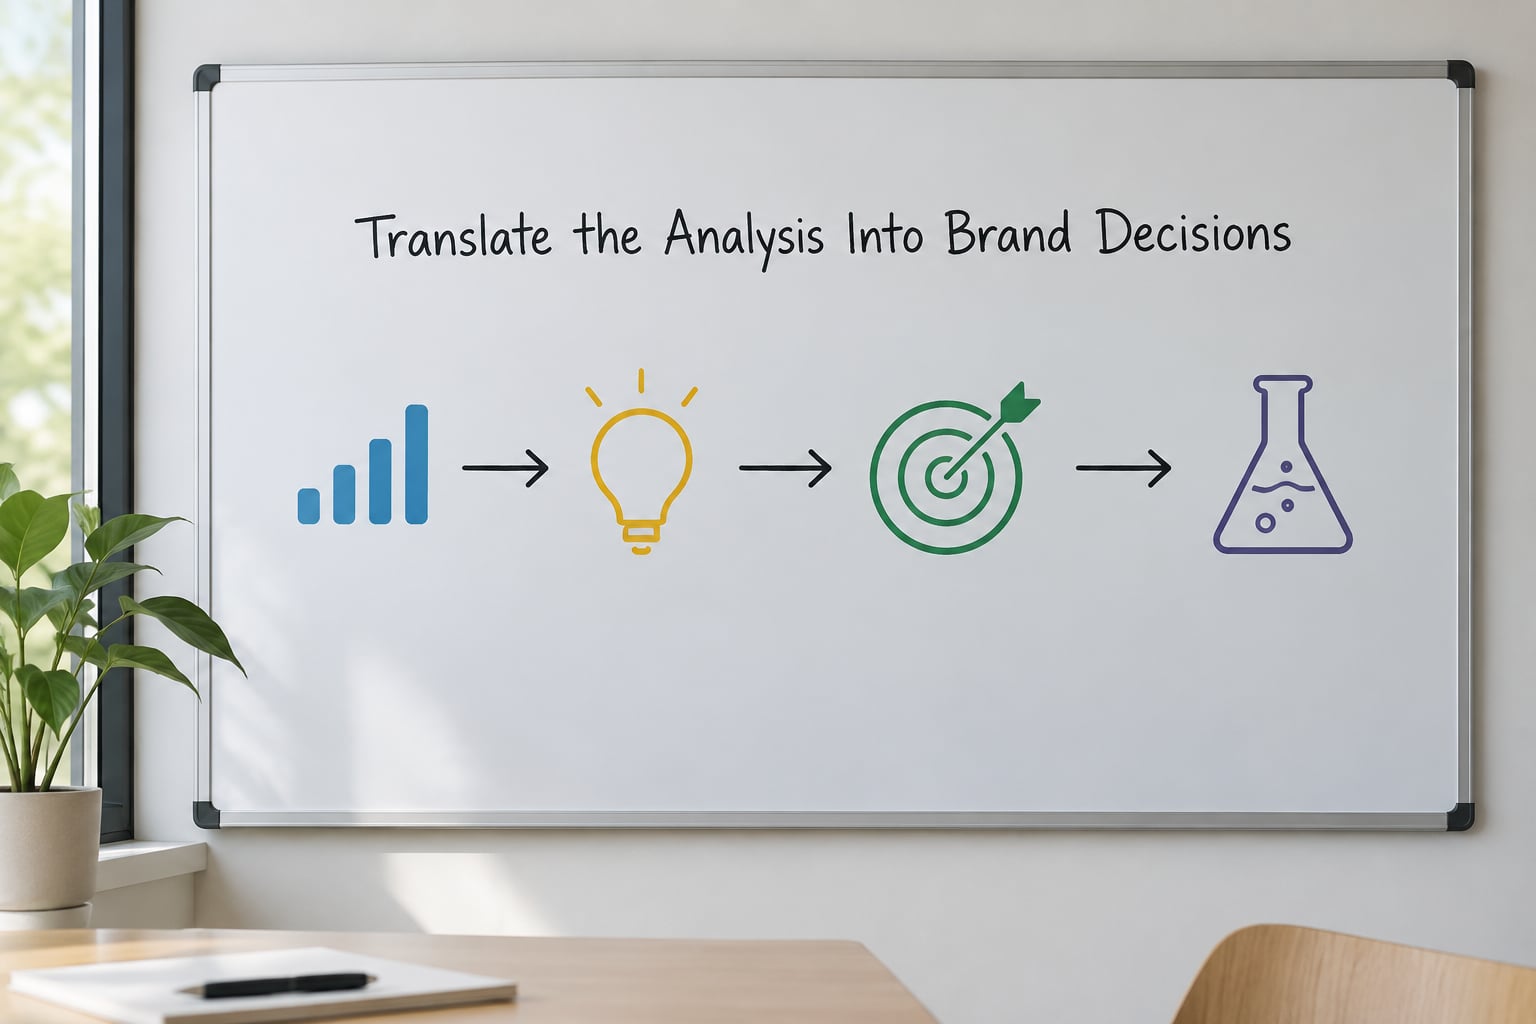
6. Translate the Analysis Into Brand Decisions
This is the stage most trend reports never reach, and it is the only one leadership actually reads. Every validated trend should leave with the same eight fields filled in.
- Consumer insight, written in one sentence a customer would recognise as true about themselves.
- Opportunity statement: if this shift is real, here is the opening it creates.
- Audience and occasion: who specifically, doing what, in what moment.
- Recommended response, at the smallest size that would still teach you something.
- Evidence level: pursue, monitor or discard, with the score.
- Owner, a person, not a department.
- Success measure, decided now rather than argued about in six months.
- Kill criteria: what would tell you to stop.
Then split your output into two lists. Act now on the trends above your pursue threshold. Everything else goes on a watch list with a review date, which is a real decision and should be written down as one. A team with twelve “monitoring” items is running a backlog, not a watch list, so cap it at five.
Briefing creative is where most of this value leaks out. Give the creative team the insight and the tension, not the trend name. “Interest in short-horizon planning tools is rising” is unusable. “People are anxious about committing to anything longer than a season, and they are proud of the flexibility” is a brief someone can build a campaign on.
7. Present, Test, and Govern the Follow-Through
A read-out that lands should take twenty minutes and follow a fixed shape, every time. Scope and decision question. What changed since last time. The three trends that moved score, with their evidence. What the team is recommending, and what it costs. One null result, deliberately included.
That last item matters more than teams expect. Reporting a trend that failed validation is the fastest way to prove the process is doing work rather than generating slides, and it is the only defence against a standing request to show “at least one thing we should do”.
Pick a cadence you can hold. Monthly works for a small team in one category and keeps the log fresh. Quarterly works better when you are covering several categories or categories that move slowly. What does not work is an ad hoc review convened when something looks interesting, because that is how a loud signal ends up driving an expensive year.
On cadence, the team function can usually be small. One hour to update the log, one hour to score, one hour for the read-out, and a short monthly maintenance slot for tuning alerts. Alert noise is the failure mode practitioners complain about most, and it is fixed by writing explicit rules: fire an alert only when a term crosses a defined volume threshold in a week, when two independent sources agree, or when a term is absent from the last three months and suddenly present.
Test small and reversibly where you can. A message test on a slice of audience, a limited-range product extension, a content format pilot for two quarters. Write down in advance what result would change your mind, because a test read after the fact is a conversation about preference rather than evidence.
Keep a record of disconfirming evidence as you go, not after a decision looks wrong. When you kill a trend you backed, record the date, the score at the time, and the signal that did not hold. It is the least flattering artifact in the folder and the one that makes the next forecast better.
Common Mistakes That Kill a Trend Analysis
Almost every failed trend program I have seen fails the same way: lots of collection, no decision, and no memory.
- Chasing a viral post. One post is a sample of one. Fix: require two independent sources and one behavioural source before a signal enters scoring.
- Collecting data before writing the decision question. You end up with an interesting answer to a question nobody asked. Fix: write the scope line first, and delete any source that cannot move it.
- Reading correlation as cause. Search interest rising alongside a product launch does not mean the launch created the interest. Fix: check whether the same shape appears in sources the brand had no hand in.
- Leaning on search volume as the only measure. Search tells you attention, not purchase. Fix: pair every demand signal with a behavioural one from CRM, site search or reviews.
- Presenting twenty trends. Nobody can act on twenty things. Fix: cap the read-out at three moved trends, and keep the rest in the log.
- Treating the report as the strategy. A deck with no owner, no test and no review date is an archive. Fix: no trend leaves the process without a named owner and a kill criterion.
- Running no counter-trend check. You back the loudest signal without noticing what is pushing against it. Fix: spend five minutes per candidate looking for the opposing movement.
- Having no shared repository. Teams repeat research they already did eighteen months ago. Fix: one live log, one owner, searchable and dated.
Tips for Making the Analysis Useful
A few habits separate the trend programs that change decisions from the ones that change nothing.
Start with a small hypothesis. Two or three candidate trends beat twenty, because a team will actually score twenty candidates properly if there are only three of them. Invite one skeptic to the scoring session on purpose, and let them argue for discarding. A program nobody ever argues about is not calibrated, just comfortable.
Label confidence on every line of the log, out loud, in words like “directional” or “strong”. Make the output a small number of decisions rather than a survey of everything happening. And revisit the previous quarter’s calls at every meeting, including the ones you got wrong, because that review is where the habit actually compounds.
One more: keep a running count of what you chose not to do. For most brand teams that number is more instructive than the list of trends they did act on.
Frequently Asked Questions
How often should a brand team run a trend analysis?
Monthly works for most teams working in one or two fast-moving categories, because it is short enough to hold and long enough for a signal to separate from a news cycle. Quarterly suits slower categories or teams covering several at once. What matters more than the interval is that the date is fixed in advance, so the analysis is a rhythm rather than a reaction to something that looked interesting last week.
What data sources are most useful for brand trend analysis?
The most useful combination pairs search demand with behaviour you own. Google Trends and a keyword tool show direction and speed; CRM, site search and review exports show what real customers did. Social listening adds the language people use, which is often where a shift appears first. Ambient scanning of trade press and newsletters catches weak signals before they reach any dashboard.
How can we tell if a trend is likely to last?
Look for persistence, breadth and function. A durable trend survives at least one news cycle without a paid push behind it, shows up in groups that do not talk to each other, and solves something rather than just looking like something. If it lives on one platform, in one age group, and disappears the moment advertising stops, you are looking at a fad, and monitoring is the right response.
Should a trend analysis be done by marketing or research?
Neither, on its own. Marketing usually holds the speed and the cultural read, research holds the rigour and the baseline. The workable model is one owner from either side plus contributors from social, media, product and whoever sits closest to sales data, with scoring done together. What breaks the process is a trend program that belongs to a team with no budget and no decision rights.
How do we measure whether a trend-driven brand response worked?
Decide the measure before the response goes out, and pick one leading and one lagging indicator. Leading measures are fast and behavioural, such as message recall or trial in a test cell. Lagging measures are commercial, such as repeat purchase or category share. Review against the score the trend held at the time, so you learn something even when the response underperforms.
What is the difference between a trend, a fad, and a seasonal effect?
A trend is a shift in behaviour or values that lasts years and shows up across unrelated groups. A fad is a burst of attention that fades within weeks or months and rarely changes what people actually do. A seasonal effect repeats in the same window every year and is predictable, so it belongs in calendar planning rather than in a trend read-out. The test is duration, breadth and whether anything is being solved.
Conclusion: Start With One Decision and One Log
The first thing to do is not a new tool. Write the decision question for the next campaign, create one dated log with a named owner, and put three candidate trends through the seven stages. You will learn more from those three than from any trend report you can buy, and you will have a process to repeat next month.