
A price sensitivity study asks people directly where a price stops feeling like a bargain and starts feeling like a rip-off, then reads the acceptable range off the answers. You do not need a research agency or a large respondent panel to do this well: a defined pricing decision, 15 to 100 matched respondents, four neutral questions and a spreadsheet will carry a small team most of the way.
The honest catch is sample size. Fifteen interviews give you direction, not proof. A hundred matched responses give you a band you can defend in a pricing meeting. Anything beyond that is refinement, and refinement can wait until a price test proves the number matters.
How to run a price sensitivity study with a small budget comes down to a repeatable process: what the study realistically costs, how to word the questions without leading people, and how to analyse the responses without buying software. It was last reviewed for accuracy in 2026.
Table of Contents
What You Need
Before you open a survey tool, sort out six things. Miss one and the study produces a number nobody can act on.
- One pricing decision. Not “we should charge more”. Something like “we move the starter plan from 29 to 49 dollars” or “we test whether a 20 percent discount lifts conversion enough to pay for itself”.
- A target customer sample. People who could genuinely buy what you sell, not a general audience panel.
- A price range to test. Your current price plus a plausible low and high alternative gives you enough spread to plot.
- A script. Four fixed questions, a short screener, and one consent line.
- A spreadsheet. One tab of raw answers, one tab of sorted prices, one tab for counts.
- Analysis time. Half a day is realistic for a small sample. Budget it or the study dies in a spreadsheet nobody opens.
A formal research panel and statistical software are helpful but not essential. The default low-cost instrument is the Van Westendorp Price Sensitivity Meter, which asks four questions and produces four reference points from the same dataset. You can run it in a free form tool and analyse it by hand.
Step-by-Step: How to Run a Price Sensitivity Study With a Small Budget
1. Define the pricing decision
Turn the broad goal into one decision with a date attached. Founders and product marketers tend to start with “find out what people will pay”, which is too wide to test anything.
Write down the product or plan, the current price, the candidate price, the segment, and the threshold that would count as a win. If the win condition is a 15 percent conversion drop over 30 days, you now have both a study and a follow-up rule. How to run a price sensitivity study with a small budget comes down to this: narrow the decision until there is only one thing left to find out.
2. Set the question for how to run a price sensitivity study with a small budget
Pick one method based on your time and budget, not on what sounds most rigorous.
- Qualitative interviews for discovery. Fifteen to twenty conversations tell you the language customers use for value and for hesitation. Best when the product is new and undefined. Limitation: no comparable numbers across respondents.
- A small survey for comparisons. Four fixed questions plus purchase intent gives you a price band you can plot. Limitation: hypothetical bias, because nobody has actually paid.
- A controlled live test for strongest evidence. Two price points, real traffic, 30 days. Limitation: it needs traffic you may not have, and it risks real revenue.
For most small teams the second option wins. Van Westendorp gives you a range from one set of numbers. Gabor-Granger asks purchase intent at several stated prices and suits a team that cares about demand curve shape. Conjoint is overkill here: it needs large samples and expertise, and it prices features rather than a single offer.
3. Recruit a relevant sample
Getting matched respondents is the hard part, and it is where most small studies quietly fail. A mixed pool of people who cannot buy your product produces a price band that describes nobody.
Work down this list until you have enough:
- Current customers who bought in the last 90 days. Best signal, but they already accepted your price.
- Lost prospects from your CRM. Ideal, because they saw the price and walked.
- Sales or support staff. They talk to buyers daily and can hand you five interviews in a week, though you must pay their incentive, not the buyer.
- A sign-up incentive on your own site or in a relevant professional community.
- A paid respondent panel if the budget stretches to it.
Screen people in with two or three questions: do you buy in this category, how often, and are you the person who decides. Set a quota so one segment cannot swamp the rest. If you can only reach 15 people from the right segment, that is a better study than 100 from the wrong one.
4. Create and test the price questions
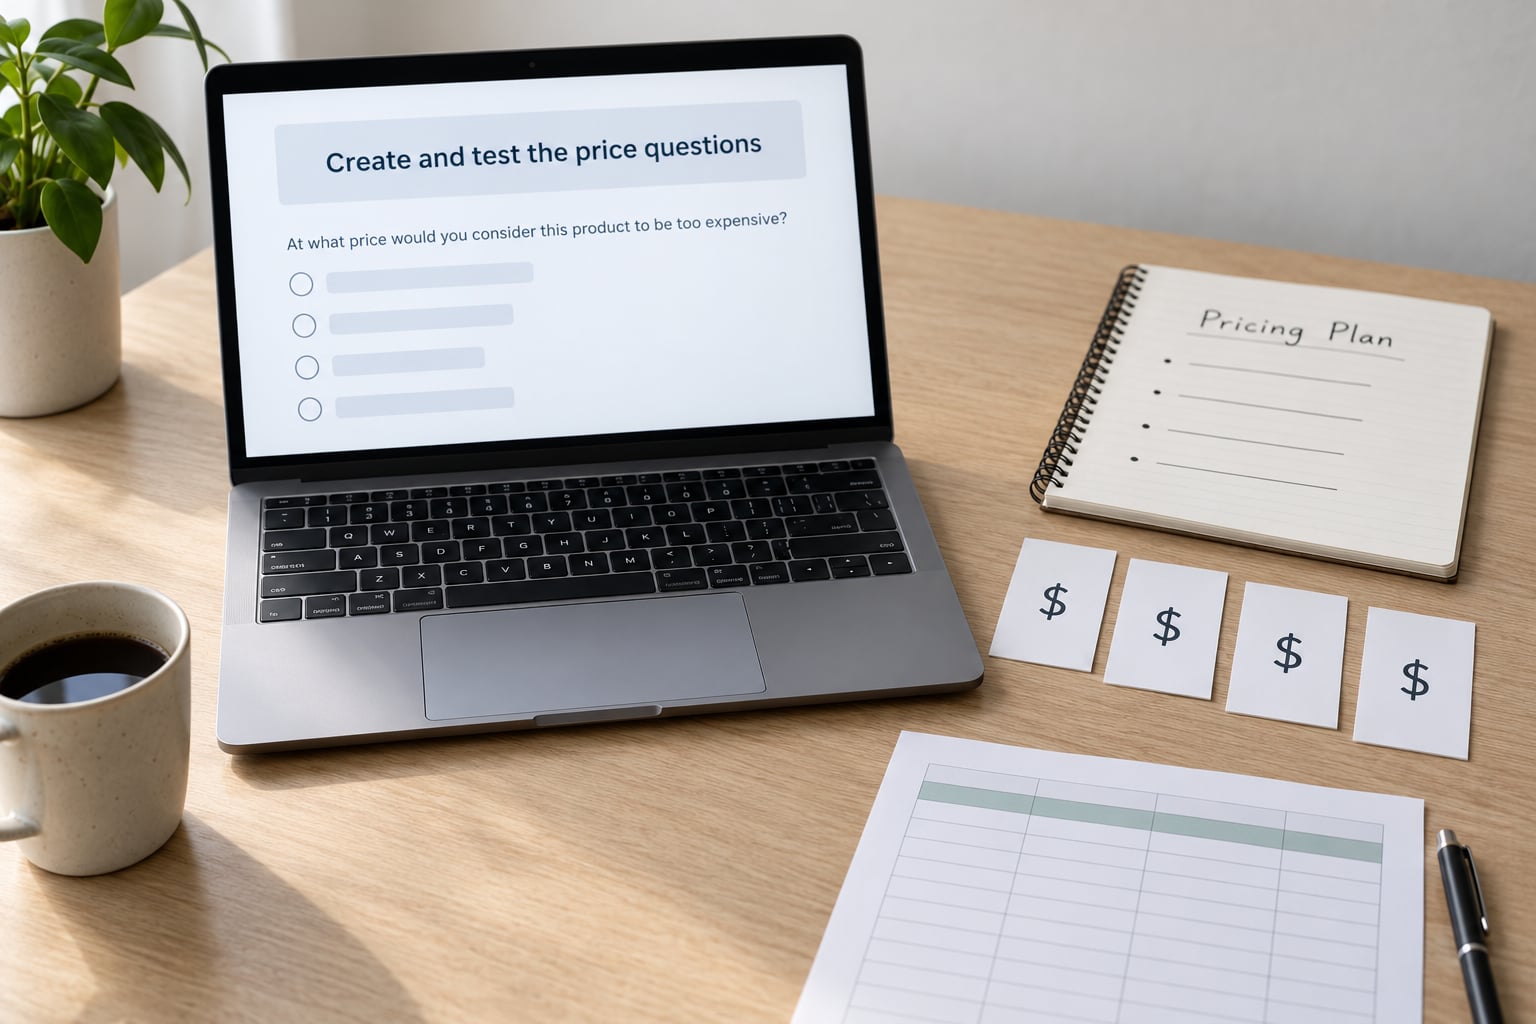
The four Van Westendorp questions must appear in the same order, with the same wording, for every respondent. Here is a copy-ready script for a product priced in dollars:
- What would be a very cheap but acceptable price for [product]? Think of it as a great deal you would be happy to buy.
- What would be a bargain price for [product]? The kind of deal that feels genuinely good value.
- What would be an expensive but still justifiable price for [product]? Something you could justify to your manager or partner.
- What would be a prohibitively expensive price for [product]? Beyond anything you would consider.
Add a screener, a consent line and two follow-ups: “which price would you most likely buy at?” and “what is the main reason you hesitate at that price?”
Neutral wording does the real work. Do not write “only 49 dollars” or “a fair price”, because both anchor the answer. Ask for a number, not a range. Ranges produce data you cannot plot. If you need purchase intent, add one extra question per price point rather than folding intent into the four.
5. Run a quick pilot
Test the script with three to five people before you field it. You are checking comprehension, not data.
Three checks decide whether the pilot passed: people understood the four questions without you explaining them, their four answers came back in a sensible order (too cheap below bargain below expensive below prohibitive), and they finished inside five to ten minutes. If answers arrive scrambled, your wording is confusing. If everyone finishes in ninety seconds, they are rushing, and your response quality will be poor. Fix the script and run the pilot again with new people.
6. Collect responses consistently
Consistency is what makes a small sample interpretable. Keep the wording, the question order and the instructions identical for every respondent. Never add a hint for the person who seems unsure.
Record four things per response: sample source, the four answers, purchase intent, and the reason for hesitation. Also log missing answers rather than filling them in. A respondent who skipped the bargain question is telling you something.
Watch for straight-lining, where someone picks round numbers in an order instead of thinking. Two identical numbers across the four questions is a flag. Keep those responses in the count but mark them, then compare the results with and without them before you rely on anything.
7. Analyze the results
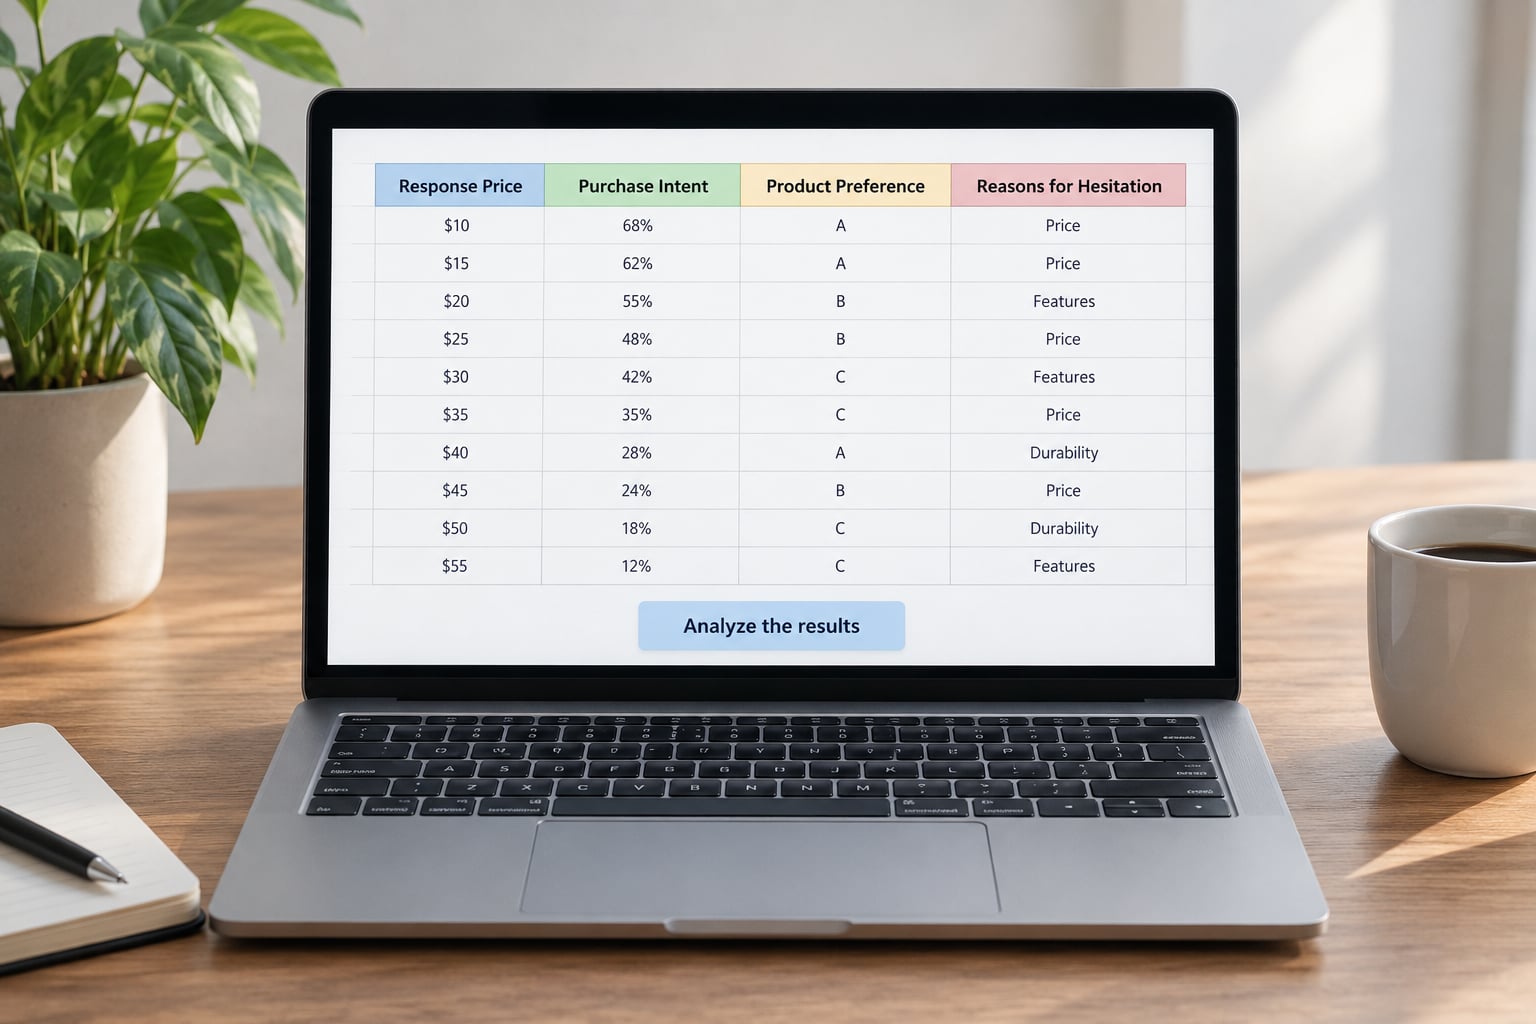
Sort each of the four answer columns from low to high and add a cumulative frequency column beside each. A free spreadsheet is enough; there is no need to buy an analysis tool for a small sample.
Plot the four curves on one chart, with price on the horizontal axis and cumulative percentage on the vertical. Four intersection points fall out of that chart:
- PMC, Point of Marginal Cheapness. Where the too-cheap and bargain curves cross. This is the floor, and it is also a quality signal. Pricing at or below it makes buyers suspect the product is bad.
- PME, Point of Marginal Expensiveness. Where the expensive and prohibitive curves cross. This is the ceiling, the point where most of your segment rejects the offer.
- OPP, Optimal Price Point. Where the too-cheap and prohibitive curves cross. The gap between OPP and PME is the range you can test without wrecking demand.
- IPP, Indifference Price Point. Where the bargain and expensive curves cross. Buyers are equally split for and against at this price.
The acceptable price range runs from PMC to PME. A working rule from practitioners is to set the price in the upper third of that band and watch conversion for 30 days, moving toward the middle if conversion falls by more than about 15 percent.
Then compute the simpler measures: the median price each group named, purchase intent at each price point, how often a discount was chosen, and the top reasons for rejection. Compare segments side by side. Published guidance disagrees wildly on sample size, so state plainly what your sample supports: fifteen matched responses give directional read, 50 to 100 give a workable band, and 150 to 300 per segment stabilise it. Treat anything below 50 as a hypothesis.
Hypothetical bias is the gap between what people say they would pay and what they pay. Self-reported willingness to pay is never a promise. That is why the next step exists.
8. Decide, document, and follow up
Turn the results into a cautious recommendation, not a launch decision. Write one sentence: “we will test 49 dollars against the current 29 dollars”, plus the band, the sample size and the date.
Name the biggest evidence gaps, usually the small sample, the missing segment or the hypothetical bias. Then validate behaviourally. A fake-door pricing page can show the proposed price with a clear “not yet available” message and count signups. A live price change for one plan, monitored for 30 days, is stronger still. Whichever you choose, write the pass/fail rule down before you start.
Finally, document what changed, what you learned, and when to repeat the study. Pricing research goes stale fast because costs, competitors and customers move. Put a recurring reminder in your calendar, six to twelve months out.
Common Mistakes and Practical Fixes
- Asking only whether the price feels too high. Yes/no answers give you no range. Fix: use all four Van Westendorp questions, which pull out both the floor and the ceiling.
- Treating a small sample as definitive. Fifteen responses produce a curve, not proof. Fix: label the result directional, and confirm with a behavioural test.
- Mixing customer types. Buyers, browsers and past customers have different acceptable ranges. Fix: one study per segment, and never transfer results across them.
- Changing the product description mid-study. Different wording changes the anchor. Fix: freeze the description and the layout for every respondent.
- Using leading questions. “Would you pay 49 dollars for this great value?” tells people the answer. Fix: neutral wording, fixed order, no price adjectives.
- Reporting averages without the distribution. One respondent with a wild number skews a mean. Fix: report the median, the full range, and where the four intersection points sit.
Two more habits worth keeping: run the survey from your own domain so a referral mix-up is traceable, and set a response deadline so late answers don’t arrive after you analysed the data. And if your existing data already shows heavy discount use or a common churn reason, read it before spending anything on a new study. It costs nothing and it frames the questions properly.
Frequently Asked Questions
How many people do I need for a small price sensitivity study?
Fifteen matched respondents from your target segment is the practical minimum for a price sensitivity study, and even that is directional. Fifty to 100 responses give you a defensible acceptable price range. Published guidance runs from 15 up to 300 per segment, so match the tier to the decision: use 15 to test whether a price is obviously out of line, and 100 or more before you change a live price.
What is the cheapest way to test customer price sensitivity?
The cheapest route is 15 to 20 buyer interviews where you ask the four Van Westendorp questions yourself and record the answers in a spreadsheet. It costs time rather than money, though interviews cannot be pooled into a plottable curve. Nearly free alternatives include a survey to your existing customer list and a fake-door pricing page that counts signups against a stated price.
Should I use interviews or a survey for price sensitivity research?
Use interviews when the product is new or its value story is unproven, because you need the language customers use for value. Use a survey when you need numbers you can compare across respondents, plot and summarise. A common pattern is both: 10 interviews to build the script, then a survey of 50 to 100 matched respondents for the band.
How do I choose the right price options for the study?
Anchor the range on your current price and two plausible alternatives, one lower and one higher, based on what customers compare you against. Avoid a range so wide it produces vague answers, and never include the answer you want to hear. The four questions then generate the floor and ceiling themselves, so you need enough spread in your recruiting prompt to make the band meaningful.
Can a small sample tell us which price will sell best?
No. A small sample tells you the range customers find acceptable, not which price converts best. Conversion is behavioural, and self-reported willingness to pay carries hypothetical bias, so people routinely overstate what they will pay. Use the study to narrow the band, then run a fake-door page or a single-plan price change and watch conversion for 30 days before committing.
Conclusion: Start With One Pricing Decision
Pick a single pricing decision and write down what a win looks like. Recruit 15 to 100 people who could actually buy, ask the same four questions in the same order, sort the answers and plot the curves. Read the acceptable range from PMC to PME and set a candidate price in its upper third.
That is how to run a price sensitivity study with a small budget end to end. Then stop treating the number as proof. Validate it with a fake-door page or a monitored price change, and repeat the study when costs or the market move.