
Reading a volumetric forecast model comes down to five questions, in this order: what grain it is built at, what history it learned from, what shape it expects, how confident it is, and what it asks you to staff. Get the first two wrong and the other three describe a forecast nobody needs.
One disambiguation first, because the phrase means three different things. In this article, volumetric means interval-level work volume: contacts, cases or orders per 15, 30 or 60-minute interval, split by skill or queue.
- Workforce management and demand planning — interval volume by skill, used to size staffing and stock. This is the article.
- Financial markets — intraday trading volume and order-book depth models. Different maths, different vocabulary.
- Construction and additive manufacturing — building volume in cubic metres, or material used in litres. Not a forecast at all.
If you landed here from a construction or trading search, this is the wrong page and you should leave. If you arrived from a planning, scheduling or capacity question, ten minutes gets you a usable first pass; allow longer when the model is new to you or contains manual overrides.
Table of Contents
- What You Need
- Step-by-Step
- Start With the Forecast’s Purpose and Time Horizon
- Identify the Dependent Variable and Unit of Measure
- Read the How to Read a Volumetric Forecast Model
- Trace Each Input Back to Its Source
- Distinguish a Calculation From an Assumption
- Read the Base, Upside, and Downside Scenarios
- Check Accuracy and Error Before Trusting the Forecast
- Convert the Forecast Into a Decision
- Common Mistakes
- Tips for Interpreting the Results
- Frequently Asked Questions
- What should a reliable volumetric forecast model contain?
- Is a low MAPE enough to trust a sales-volume forecast?
- How much historical data does a volumetric forecast need?
- How can I tell whether a volume forecast is systematically biased?
- When should I rebuild a volumetric forecast model instead of adjusting it?
- What does WFM mean in the BPO sector?
- Conclusion: What to Review First
What You Need
Reading a forecast is a document review, and like any document review it fails when you are missing a page. Before you open the file, line up these ten things.
- The model output itself — the workbook, dashboard or export with the interval grid.
- The data dictionary — field definitions, because “volume” is defined differently in every organisation.
- The stated horizon — how far out the forecast runs, in weeks or days.
- The historical volume series — the actuals the model learned from, at the same interval length.
- The baseline definition — what the model treats as normal, and what it treats as an event.
- Segment and channel breakdowns — the split by skill, queue, region or channel.
- Assumption notes — written wherever they exist, however thin.
- Scenario controls — the switches that produce base, upside and downside cases.
- Accuracy metrics — holdout results, bias, and the error measures the tool reports.
- Access to the analyst who built it — the person who can answer why a method was chosen.
Two of these do more work than the rest. The historical series and the baseline definition are where most misreadings start, because the forecast file shows you the output and hides both of them.
Step-by-Step
Eight steps, in order. Each one ends with a check, because a step without a check is just an opinion.
Start With the Forecast’s Purpose and Time Horizon
Ask what the model predicts, in what unit, across which products and channels, over what period, and for which decision. A 13-week daily forecast built for rostering answers a different question from a 24-month monthly forecast built for a headcount budget, and neither answers the other’s question well.
Horizon also determines how much weight each number deserves. In most interval volume models, accuracy decays with distance from today, which is why the first few weeks are usually tighter than the last. Treating a week-12 figure with the same confidence as a week-1 figure is one of the most common errors I see.
Check: if you cannot state the forecast in one sentence — what, in what unit, over what period, for what decision — you have not started reading yet.
Identify the Dependent Variable and Unit of Measure
The dependent variable is the thing being predicted. In volume work it might be raw contacts, cases, equivalent units, revenue, workload minutes, or concurrent demand, and each one produces a different staffing answer from the same underlying data.
The classic category mistakes run in both directions. Contacts and cases are counted differently, often by a ratio near three contacts per case, so mixing them inflates or deflates headcount without anyone noticing. Shipments and sell-through units describe different moments in time. Revenue and volume diverge the moment a price change lands inside the history window.
Check: convert one interval’s number two ways — raw volume and, if a handle time exists, workload minutes — and confirm both appear consistent with the same underlying contacts.
Read the How to Read a Volumetric Forecast Model

The fastest first pass is a spreadsheet-style view with seven things visible at once: the headline forecast, the historical actuals, the model inputs, the forecast periods, the error measures, the scenarios and the assumptions. If the output forces you to open five tabs to see those, ask for a one-page view before you interpret anything.
Expect the output to be a grid. Intervals run down the side, skills across the top, one number in every cell, with a daily total row underneath. That layout is worth checking on its own: add the cells and compare the sum with the daily total printed elsewhere in the report. A mismatch almost always means a filter difference, not a rounding issue.
Check: you can point at a single cell, name the interval, name the skill, and say what number sits there without guessing.
Trace Each Input Back to Its Source
Classify every input into one of four buckets: historical, observed, estimated, or assumed. Historical means it came from recorded actuals. Observed means it was measured recently, such as this week’s calls. Estimated means a model inferred it. Assumed means somebody decided it.
Then check the boring details that decide whether the input is usable. What frequency does it update? Which geography does it cover? Does it span every segment? What date range? Has it been transformed — smoothed, capped, backfilled — since collection? And is the source itself trustworthy, or is it a spreadsheet somebody maintains by hand?
Check: pick the three largest inputs and name where each one physically comes from, including the date it was last touched.
Distinguish a Calculation From an Assumption
A calculation is arithmetic that anyone can reproduce. Users multiplied by purchase frequency is a calculation. Expected market share, distribution points, awareness lift and adoption rates are assumptions, because no formula produces them — somebody chose them.
Both belong in the model, but they carry different risk. A formula error shows up in the error metrics and gets caught. An assumption sits quietly inside the output until the world disagrees with it. Every judgmental input should have a named owner and a review date; if it has neither, that is your first escalation.
Check: for each input, say the words “computed” or “chosen”. If you cannot, ask who chose it and when.
Read the Base, Upside, and Downside Scenarios
Scenarios are decision statements, not error bars. The base case says one thing about the future, the upside says a better thing, and the downside says a worse one. Ask exactly what changes between them: one assumption, three assumptions, or a different history window entirely.
Symmetry matters. A downside case that is only 2% below base while the upside is 15% above is not a balanced range, and treating it as one biases every decision toward caution. And a scenario set is not a statistical confidence interval — it does not carry a probability unless somebody explicitly assigns one and defends the number.
Check: you can list the changed assumptions between the three cases without opening a second file.
Check Accuracy and Error Before Trusting the Forecast
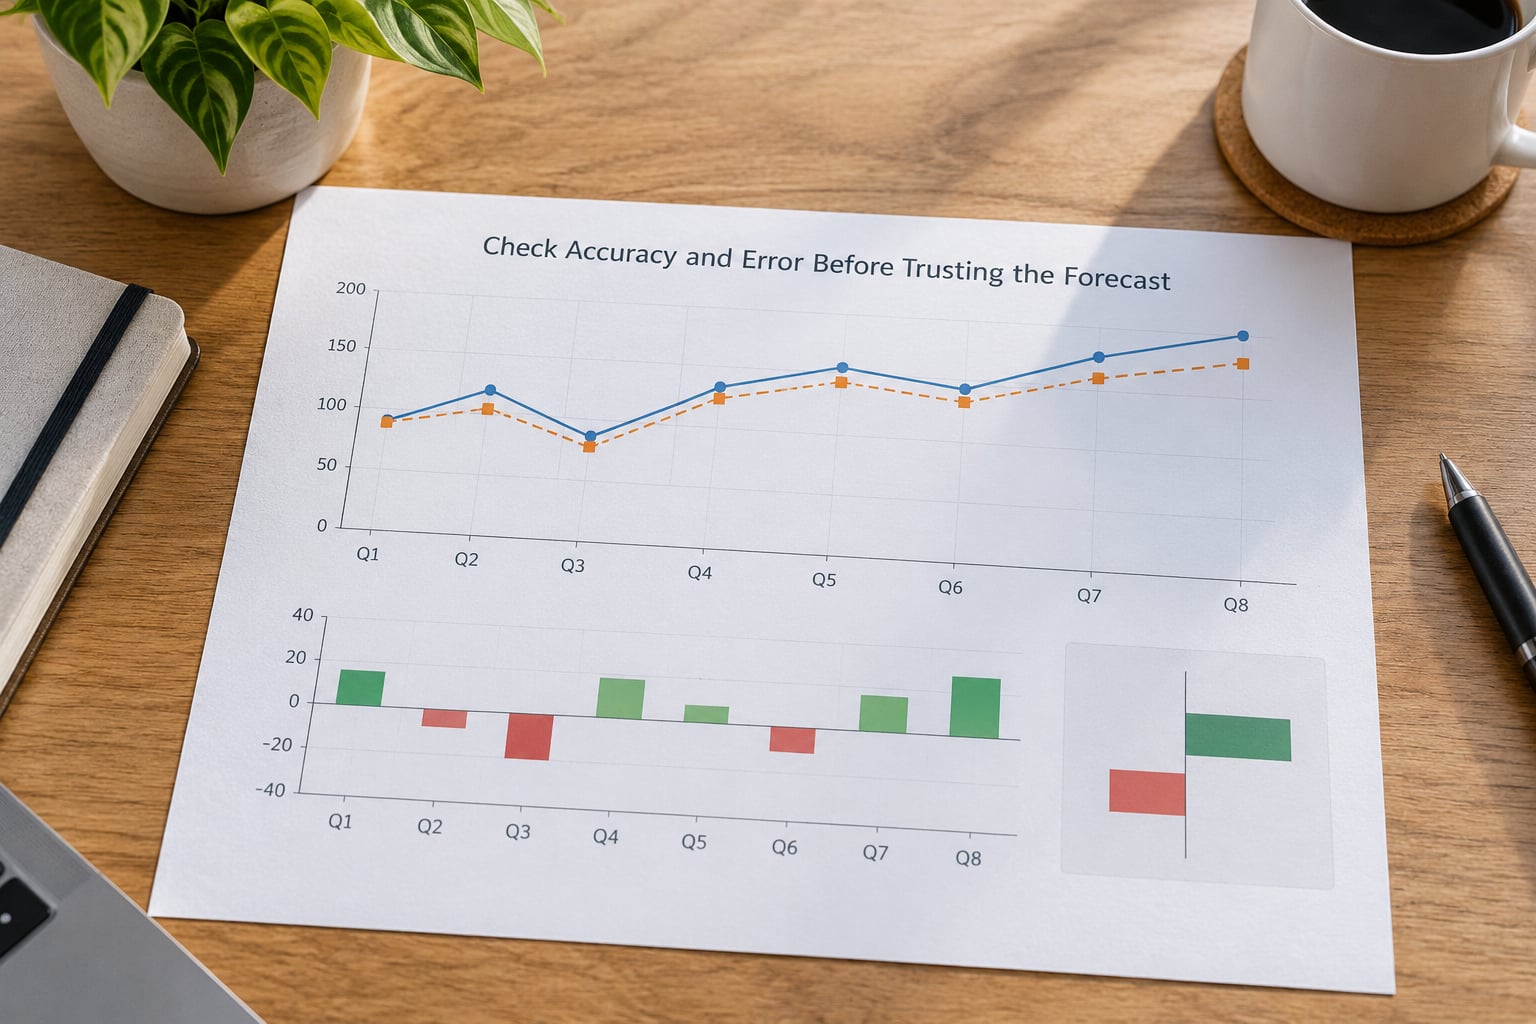
Look for four things: holdout results from a period the model never saw, bias, a residual pattern, and forecast value added. Holdout performance is the only one that tells you anything about the future.
MAPE, the mean absolute percentage error, is the most quoted metric and the most abused. It explodes when actual volume approaches zero, which is exactly the case for a small queue or a night-time interval, so a flattering MAPE can hide a badly behaved tail. MAE and RMSE give you the error in real units, which is more useful for planning. Bias tells you the direction: a forecast that runs 6% high every month under-staffs quietly, month after month.
Check: does forecast value added exceed the error of a plain seasonal average? If it does not, the complexity is not earning its place.
Convert the Forecast Into a Decision
Volume is an intermediate result. The decision lives several steps downstream: volume to workload, workload to required agent minutes at a target occupancy, then required minutes to scheduled people after shrinkage.
The arithmetic is worth doing by hand once. Take a 30-minute interval forecast at 120 contacts. At an average handle time of 6 minutes, workload is 120 × 6 = 720 minutes. At 85% occupancy, you need 720 ÷ 0.85 = 847 minutes of agent time on the floor. Apply 30% shrinkage and 847 ÷ 0.70 = 1,210 minutes of rostered time, which is 1,210 ÷ 60 = 20.2, so 21 people scheduled. A 5% forecast error on that interval moves headcount by about one person, which is why a small percentage matters operationally.
Check: you have stated the occupancy target, the shrinkage assumption and the service level before quoting the staffing number, because each one moves the answer more than the forecast does.
Common Mistakes
These seven show up repeatedly, and each has a specific correction rather than a general warning.
- Reading correlation as cause. A forecast often rises because two series share a calendar, not because one drives the other. Correction: ask which series the model actually consumed, and whether a change in one would move the output on its own.
- Treating the base case as inevitable. Base is the most likely single path, not the safe one. Correction: make the decision at the downside case and check you can still serve the customer there.
- Mixing time periods. A daily figure from the base case gets compared with a weekly figure from the upside. Correction: write the unit and horizon next to every number before it leaves your desk.
- Ignoring aggregation bias. A 6% aggregate error can hide a 20% error on one channel. Correction: check bias by segment, not just in total.
- Never inspecting segments. The total looks fine because two errors cancel. Correction: rank segments by absolute error and look at the worst one first.
- Double-counting inputs. A promotion volume added on top of a history window that already contains the promotion. Correction: check whether the event period is inside or outside the training window.
- Reading scenarios as probabilities. Assuming the upside case is “likely”. Correction: if no probability is stated, none is implied.
Tips for Interpreting the Results
- Write a one-sentence forecast statement. If you cannot, the reading is not finished. This takes five minutes and catches most unit errors.
- Change one assumption at a time. Move distribution points, leave everything else, re-run. Two changes at once produce a number you cannot attribute.
- Compare against a naive benchmark. A seasonal average from the same intervals last year. Beating it is the minimum bar for keeping the model.
- Document manual overrides. Every adjustment you make after the model publishes goes in a log with a reason, or the accuracy metrics become meaningless.
- Report a range, not a point. Base with a band is honest. Base alone reads as certainty you cannot support.
- Re-read the assumptions quarterly. Method choices tend to outlive the data that justified them.
Frequently Asked Questions
What should a reliable volumetric forecast model contain?
A reliable model states its interval length, its forecast horizon, the history window it learned from, its baseline definition, its segment split, and its named assumptions. It reports holdout accuracy, bias and an error measure in real units, not just a percentage. It separates base volume from event volume rather than blending them. If any of those are missing, you are reading a number, not a model, and you should ask the analyst who built it before acting.
Is a low MAPE enough to trust a sales-volume forecast?
No. MAPE behaves badly when actual volume approaches zero, which is normal for night-time intervals and small queues, so it can flatter a forecast that is badly wrong exactly where it matters. Bias tells you the direction of the error, and that direction decides whether you under-staff or over-staff. Holdout performance on a period the model never saw is more informative than any in-sample figure. Check all three before you trust the number.
How much historical data does a volumetric forecast need?
Enough to cover the full seasonal cycle of the intervals you forecast. For interval volume that usually means at least a year, so every day-of-week and seasonal pattern appears at least once and ideally more. Two to three years is better where demand shifts slowly. With less than a year, the model can reproduce a trend but not a season, and you should widen your confidence band to reflect that rather than presenting the point estimate alone.
How can I tell whether a volume forecast is systematically biased?
Add actuals and forecast across a long window and compare totals. A forecast that consistently sits above the sum of actuals has a positive bias and will under-staff quietly, because the gap looks small each period and accumulates over the quarter. Then repeat the check by segment and by period, since a small aggregate bias often hides a large one on a single channel. Bias is more actionable than percentage error because it points in a direction you can correct.
When should I rebuild a volumetric forecast model instead of adjusting it?
Rebuild when the data generating process has changed rather than the parameters — a new product, a new channel, a structural break in demand, or a history window that no longer resembles current behaviour. Adjust when the model logic is sound but one input moved, such as a distribution change or a known event. If the model has not beaten a seasonal average on holdout data, rebuilding is usually cheaper than continuing to tune it.
What does WFM mean in the BPO sector?
Workforce management. In a BPO or outsourced contact centre it covers the whole cycle from forecasting interval volume through shrinkage and occupancy calculations to scheduling, intraday monitoring and reporting. The forecast model is the first step in that chain, and every later step inherits its errors. That is why the volume forecast is worth reading carefully rather than accepting as an input to the scheduler.
Conclusion: What to Review First
Work through these in order and you will know whether to act on a forecast in under half an hour. Define the decision the forecast exists to support, confirm the unit and the horizon, then trace the three largest assumptions back to a named owner and a date. Check holdout performance against a seasonal average, read the bias by segment rather than in total, and finally run the downside case through the volume-to-headcount arithmetic before you sign anything off.
Everything after those six steps is refinement. The mistake I see most often is starting at the end — quoting the number to a stakeholder before the grain and the basis are confirmed.